hedge-fund.io
Testing Predictive Signals - Part 1
CBOE Put-Call Ratios as Predictive Signals
Published: 11 January 2026
|
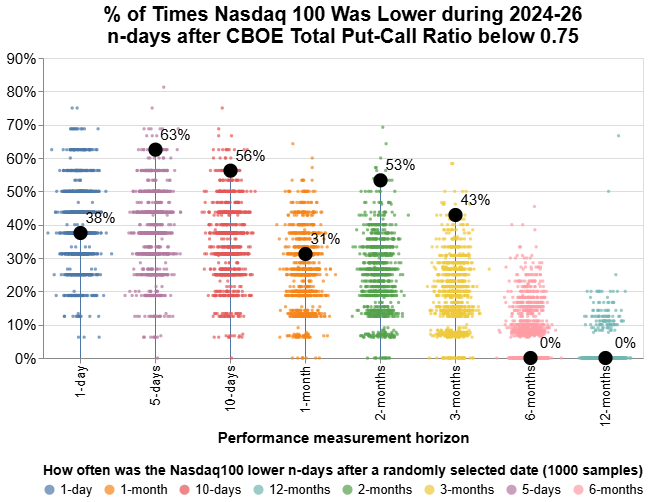
How to read: There were 16 instances where the CBOE Total Put-Call Ratio (PCR) was below 0.75 in 2024-26. Large black dots are “% of times Nasdaq 100 was lower n-days after the CBOE put-call ratio was below 0.75”. E.g. the Nasdaq 100 was lower 10/16 (~63%) times 5-days after the PCR hit 0.75. Each small colored dot represents the proportion of times that the Nasdaq 100 was lower n-days after a randomly selected date, from 1000 samples.
Can Put-Call Ratios Predict Stock Market Changes?In light of recent articles about equity market levels, we decided to look into testing some indicators for predictive power. A series of these indicators are ratios referred to as “put-call ratios”. These are ratios of put-option buying against call-option buying, as traded on the Chicago Board of Options Exchange (CBOE).One might think of call-buying as a bullish signal and put-buying as a bearish signal. And therefore if there are more calls being bought than puts, and therefore the put-call ratio is below 1, that market participants expect the market to go up. There is an alternative interpretation. In recent years retail traders have become a vast proportion of daily trading volumes, including for options. And if you’ve used one of these trading platforms before you will undoubtedly have seen the disclaimers along the lines of “75% of traders lose money on this platform”. So it may well be that put-call ratios are a contrarian signal - that when the put-call ratio is low, it means market participants expect the market to go up - but if they are wrong most of the time, then it stands to reason that the market should go down. The Signal: CBOE Total Put Call Ratio below 0.75So we took the Total Put-Call Ratio since January 2024 and identified 16 instances where the ratio dipped below 0.75. And for each of those instances, we calculated the performance of the Nasdaq 100 over a range of trading time horizons - 1-day, 5-days, 10-days, 1-month, 2-months, 6-months and 12-months.As an example - for the 16 PCR signals, we could calculate 16 1-day changes for the Nasdaq 100 and in 6 of these instances (6/16 = 37.5%), the Nasdaq 100 was lower. Not that interesting. But 5-day, 10-day, and 2-month horizons look far more promising with the Nasdaq 100 lower 63% (10/16), 56% (8/16) and 53% (6/16) respectively. Benchmark: 16 randomly selected dates, sampled 1000 timesAs a benchmark to test this signal, we ran 1000 simulations where we randomly selected 16 dates in the 2-year measurement period, and calculated changes in the index for each time horizon in the chart. For each of these 1000 simulations, we calculated the proportion of times that the index was lower and plotted these on the chart above. This creates a distribution of points that can serve as a benchmark to measure the predictive power against.This should also be seen in the context of the Nasdaq 100’s performance over the past two years. In a market that has seen a nearly 50% increase over 2 years, the average change, over any horizon, is likely to be positive rather than negative. So even if a signal shows the index lower only 50% of the time, it is better than a coin-flip and has some predictive power. And this can be seen from the clustering of sample proportions well below 50%. ConclusionThere is some evidence that the CBOE’s Total Put Call Ratio is predictive of the Nasdaq 100 when the ratio hits below 0.75, across some time horizons. It would be interesting to test this further by varying the ratio values, the time horizons and the markets to strengthen statistical significance.Disclaimer: This post tests the predictive power of a signal on a major US equity index and so additional caution is warranted - this should not be read as an inducement or recommendation to trade, or not to trade, in any way and we accept no responsibility for the accuracy of this data or conclusions drawn from it. Do your own data collection and research/testing/due dilligence and exercise discretion in any investment decision. Theme: Signal Testing Tags: CBOE, Put-Call Ratio, Nasdaq 100 Data from: Chicago Board of Options Exchange Disclaimer: Not financial advice. Please review original sources, conduct your own analysis and due diligence, and make your own investment decisions. Author takes no responsibility for the accuracy or inaccuracy of this data. If you want to get in touch you can reach us at hello at hedge-fund dot io |