hedge-fund.io
Snippets
|
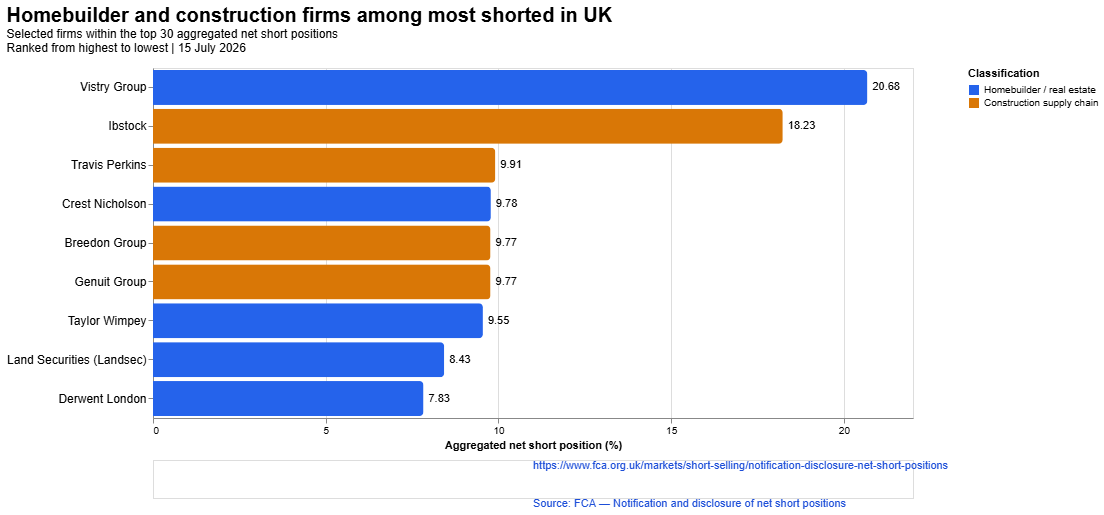
Snippets are works in progress and so ask questions rather than attempt to provide answers (yet). UK homebuilders most shorted by hedge funds - 15 July 2026
1Short interest data from FCA
Disclosure: We recently increased our long positions in various UK homebuilders. Not financial advice. Do your own due diligence and research. FCA Changes Short Reporting Rules The FCA changed their reporting process for declaring short positions. They no longer list individual funds behind short positions and they have lowered the reporting (or publishing) threshold from 0.5% to 0.2%. The net effect of which is that we can no longer produce the granular chart from the previous short disclosure. On the other hand, it reveals a closer approximation to the true short position - for example showing a 20% of float aggregate short position in Vistry PLC. UK Homebuilders have a large instituitonal ownership base Depending on which source you consult, 60-90% of shares of Vistry are held by institutional investors. With a market cap of £841m, of which nearly £170m is shorted only about 10-40% (£84m - £320m) of shares aren’t in institutional hands. Much of this is also held by mutual funds and ETFs which might not necessarily sell off shares soon, especially if they’re carrying an unrealised loss. So if there’s a sudden surge in buying, on the back of a headline or the announcement of more detail of the “biggest council house building programme since the postwar era”, or further falls in gilt yields (all of these are MAJOR ifs), we wonder whether a “short squeeze” might occur - a rush to cover short positions opened or deepened at already all-time-low levels. Dear Andy Burnham: Build More Houses We think more houses should be built in the UK, of various sorts - council houses, mansions, and multi-family residential blocks and skyscrapers alike. Perhaps homebuilders need reform and perhaps they need to fail or reach death’s door, at which point the government may rescue them and wipe out equity holders’ positions (such as ours). But perhaps they need more money, a supportive regulatory environment, and a charismatic champion in No10. And perhaps a bit of a scathing, even shaming media campaign targeted at international hedge fund giants with balance sheets in the billions, bleeding out what remains of a sputtering homebuilder sector. Shorting is not inherently bad Make no mistake - we support activist investing and that includes shorting at times.. And if a hedge fund sees a company being poorly run, perhaps shorting it is both the prudent and moral thing to do. But if a problematic environment - whether because of funding, market or regulatory conditions - is weighing on a company, then perhaps shorting it into oblivion, rendering its workforce unemployed, and ultimately hamstringing its ability to take risks or to hire talented people - perhaps then shorting no longer has the moral highground. Barratt Redrow announced a £400m stock buyback, instead of paying out dividends today. Its stock was up only about 4% today. Crest Nicholson, which reports earnings tomorrow, was up around 10%. A handful of homebuilders are up around 20% since the mid-June lows. We’ve seen this before. It is very likely the case that this is one of the last upticks in a secular stagnation that ends in bankruptcy or restructuring on a sector wide level, perhaps even providing the new Prime Minister with a platform to support nationalisation or reform of these companies. We hope not today. We hope funding conditions ease and that the new leadership puts its money where its mouth is, and builds some more houses. Ultiamtely investing is about providing capital to organisations to take risk on your behalf, and to provide value to society. Building houses is perhaps one of the most beneficial of these. Just be sure to build them where people actually want to live. Who is Short UK PLC and What if Burnham is Good for Real Estate? - 25 June 2026
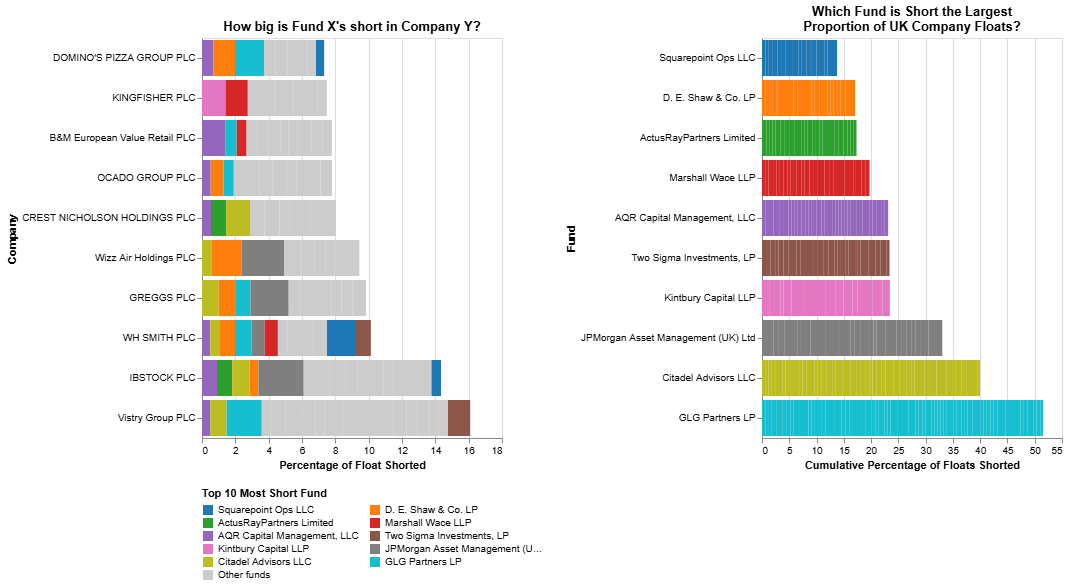
1Short interest data fromFCA We find ourselves interested again in the bloodsport of catching falling knives - more specifically, which UK companies have performed poorly, are currently most “shorted” (according to the FCA) and could have near-term triggers for a turnaround? A somewhat embarrassing declaration: we own Ocado, Wizz Air, Ibstock and Vistry Group and some other homebuilders. Suffice to say national pride has not served us well here. Segro rejected a £12.6 billion takeover offer from Prologis and still saw its share price climb with nearly 20% yesterday. This helped to put the MSCI UK Property ETF up over 6.6%, its 3rd best day in 5 years (topped only by the March 2020 Covid meltdown recovery, and a spike in 2023). We also noted that a handful of deeply beleaguered UK homebuilders (Vistry, Barratt, Berkeley, etc) were up a few % points today and seem to have recovered from their lows in mid-June. Now a single such data point does not a pattern make - but could it be the start of something more? What would it take to bring the hyperscaler playbook (vendor financing or cross-ownership investment deals) to the UK homebuilder industry? We could not help but notice that this performance aligns quite well with the surge in Andy Burnham’s odds on Polymarket of becoming the next UK Prime Minister (and incidentally with falling gilt yields). Burnham’s Manchesterism could well see more of the booming development which he championed in Manchester, and seemingly quite actively supported with his approval of loans to Daren Whitaker’s Renaker. He is already outlining plans for devolution, with intentions to set up a “Number 10 in the north”, with powers over some areas like skills and taxes being delegated to regional bodies. UK Homebuilders We won’t go so far as to say Burnham’s election as prime minister is going to spur a homebuilding renaissance that will lift these sputtering British stocks back to their multi-billion pound former glories (one can dream). But we would not be surprised if a kind of “buy the rumour” trade emerged - that Burnham might be good for the prospects of real estate developers. Because Burnham has certainly proved that people can make a lot of money through building real estate development. And it’s far more noble, we think, to make money from building lots of houses (whether they’re affordable/social housing or luxury highrises - ideally both) than from just sitting on houses which appreciate because of supply constraints. 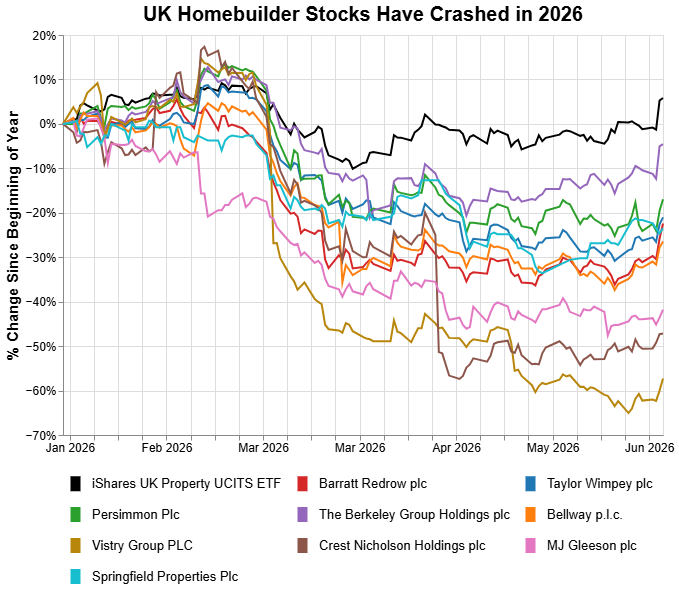
1Stock data fromYahoo! Finance A Decent Proposal We believe homebuilding in the UK will happen when the correct incentives are in place. Cynically, we think that means when both political incumbents and the constituents they serve stand to benefit more from increasing the housing supply, than from merely keeping it as restricted as possible. In light of these we (somewhat tongue in cheek) propose the following ideas to facilitate that:
Could Diamonds be AI’s best friend? - 4 June 2026
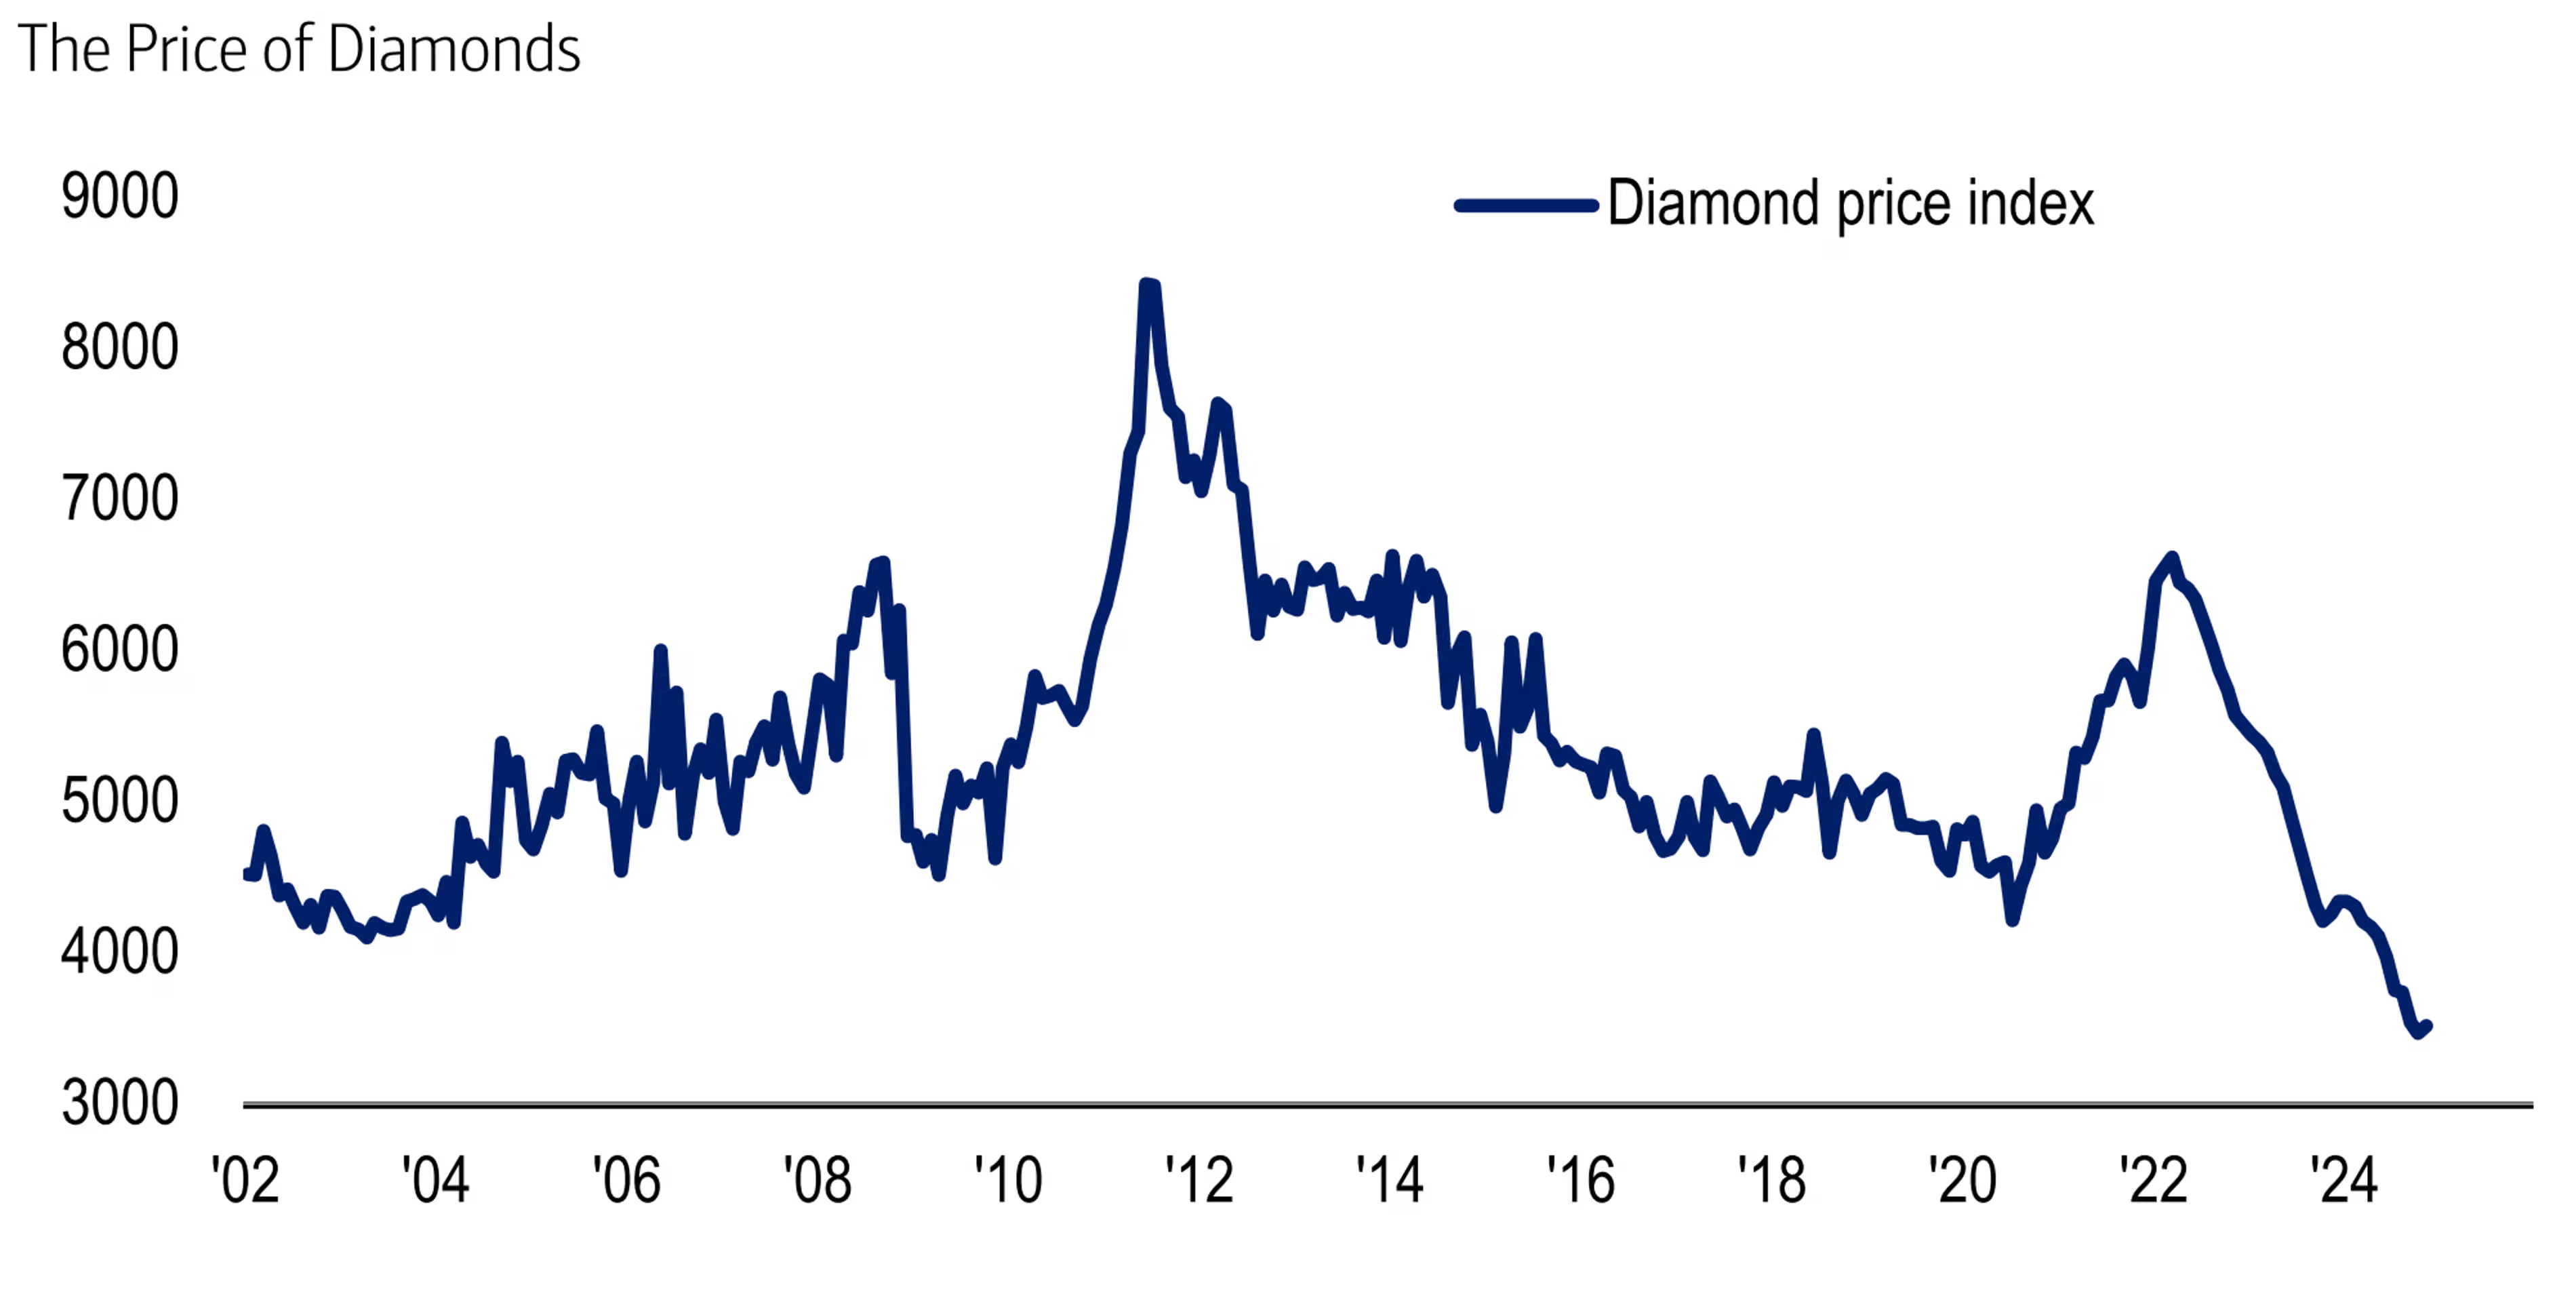
1Image from BofA via The Guardian When you walk out of Bond Street station there is a massive De Beers billboard. Known for their iconic "A Diamond is Forever" marketing campaign, their marketing has seemed absent in recent years while a collapse and consolidation has taken place in the natural and lab grown diamond industry. In October 2025 they announced their largest category marketing investment in a decade around Desert Diamonds and have followed up this week with further promotion. And there appears to be the faintest hint that diamond index prices are stabilising after a precipitous decline since 2022 to record lows. The record lows also drew the attention of Apollo’s Torsten Slok. We think something is happening. The perfect storm which has led to these price declines (over supply of both natural and synthetic diamonds ) may be starting to reverse - tightening of supply, increased industrial demand for synthetic diamonds, and a renewed marketing push from De Beers potentially driving natural demand. Cooling transistors with diamonds A recent Bloomberg article highlighted the sharp rise in stock prices of Chinese companies related to the use of synthetic diamonds in new chip-cooling applications. In October last year a Stanford research group published findings on how they managed to grow polycrystalline diamond at low temperatures and through integration with gallium nitride transistors significantly lowering device temperature. Investing in “AI supply chain” stocks have become something of a meme in recent weeks, particularly following the release of Dylan’s AI bottlenecks app and caution is certainly warranted. However there is potentially an investment narrative here. If lab-grown diamond production capacity gets shifted to this cooling use case perhaps the sputtering diamond mining sector may be due for a revival. Diamonds have also been used for high bandwidth non-volatile storage as highlighted in this recent (2026) paper published in Carbon journal. Stabilisation in Lab-grown diamond prices Wholesale prices for lab grown diamonds appear to be stabilising, after having fallen over 90% since 2018, based on the Lab Grown Diamond index from Edahn Golan. Q4 saw the smallest quarterly decline in prices since the introduction of the index, around 5%. Costs for high-pressure high-temperature lab grown diamonds have started to increase as Chinese HPHT factories collectively ceased price cutting. The 2025 BriteCo report highlights that nearly half of engagement rings purchased in the US contained lab grown diamonds and that significant price disparity persisted with a 1-carat lab grown diamond averaging $1000 compared to around $4200 for the natural equivalent. Perhaps we will see some of Jevon’s Paradox here - in that as prices have declined, overall demand for the resources may increase as it becomes more accessible to a wider range of buyers. Average carat sizes for lab grown rings have nearly doubled since 2019. If synthetic diamond prices rise, and with it the jewellery that contains them, this could spur price increases for natural diamond jewellery as well. Contraction in Natural Diamond Supply Diamond output in the world’s second largest extractor is being constrained. Botswana is sitting on a diamond stockpile of double its targeted inventory level. Low prices brought on by weak global demand and the proliferation of lab grown diamonds have forced the Debswana joint venture with De Beers to temporarily suspend some mines’ production last year. In 2024 Botswana produced 18 million carats of diamonds, second only to Russia. Alrosa, the world’s largest diamond producer, accounts for more than a quarter of the world’s diamond extraction despite having been sanctioned by the US and the EU in recent years. In addition to these sanctions, Russia is now also considering imposing export duties on some rough diamonds. Verdict We have seen a certain price cycle repeat over and over:
The extent to which this process will repeat for diamonds remains to be seen, and the extent to which an investor can capitalise on this is also not entirely clear - listed diamond mining companies could be on their last legs and may very well fail or become acquisition targets by larger players before (if ever) their share prices recover. It is fraught with risk. But their depressed share prices could present an asymmetric opportunity - we think it might be worth a position. We’ve allocated some capital to a handful of listed diamond mining names and still hold a small position in Anglo American. DiamondFloor - A Marketing Proposal As part of this investigation we also propose the idea of a DiamondFloor: a marketing entity, vertically integrated and owned by the mining company, which sets a minimum floor price guarantee for the price of the stone which is inline with the final consumer price of the diamond. This can initially be limited to specific stones of exceptional quality and size and, in order to highlight the superiority of natural diamonds, this can be integrated with blockchain provenance/origin services like Tracr which DeBeers has been developing since 2018 and which the GIA recently took a 30% stake in. Historically diamond jewellery has had significantly reduced resale value, partly because of overheads that retail distributors (shops) have to cover. But if the retail shop is sufficiently vertically integrated and if ancillary costs are a sufficiently small percentage of the total cost of the jewellery, they could potentially offer a price floor without jeopardising their profits, while maintaining a “guarantee” of value for a premium, exceptional, rare item. After all - how many people will really return a high-end piece of jewellery? And if one’s business model cannot withstand that risk, are you really in a sustainable and truly value-adding business? Perhaps for this to work diamond producers would first need to turn the tide of decreasing prices. Perhaps that has already happened. The State of AI Part 3: Token-minning - 27 May 2026Demand for compute has been driving the demand for GPUs and with it the demand for memory, CPUs and perhaps the entirety of the AI trade. Token-usage underpins compute demand and various market participants see token-usage growth continuing on its recent parabolic trajectory. However past results do not guarantee future returns - there is no guarantee of this growth. Scenarios that could, in the very near term, begin to weigh heavily on this token-demand:
The Continued Rise of Local Adam Conway, XDA’s lead technical editor, recently shared his experience of using a locally run LLM to replace ChatGPT for various uses. Running Alibaba Qwen-3.6-27B on his Radeon 7900 XTX he was able to perform a number of tasks that he’d normally use ChatGPT for. That model beats the previous generation Qwen3.5-397B-A17B MoE on SWE-bench verified - an impressive feat to say the least. It also performed well on vulnerability detection. And adding the coding agent Pi to it rounds off the experience. Electricity usage was also entirely reasonable. It will be interesting to see whether this story gets repeated and more people start entirely relying on local models for most of their AI queries. Technical Innovations at the Frontier Brandon Carl highlights the following reasons for the “end of the resource exponential”:
It is no secret that a wave of AI startups are looking into the question of how to make models more efficient. We expect these sorts of companies to proliferate. We wonder however whether the hyperscalers will simply invest in or acquire these sorts of companies which could slow down the impact of their findings. Token-Maxxing Backlash continues
Uber COO Andrew Macdonald is the latest prominent business figure to come out against significant spending on AI without a clear way to measure the impact it is having. This follows earlier statements in April by Uber CTO Praveen Naga that Uber had by then already exhausted its 2026 Claude Code budget. Microsoft recently also mentioned that the company had started cancelling Claude licenses after token budgets were overrun and instead many developers will use Github’s Copilot CLI instead. Token-maxxing.io highlights a handful of other companies that have appeared in the news recently in articles on that topic. It should not come as a surprise that this phenomenon will likely be used as a justification to increase the resolution of scrutiny over AI use in companies, which will likely include more itemised monitoring and productivity assessments of employees as well. Aiswarya Sanker of EntelligenceAI’s Twitter post that of each $1 total AI spend, 44% is lost on bug fixes and only 18% reach users, has already received over 1m views in a day. Ultimately there appear to be significant forces already in play driving towards more efficient token-usage - by enterprises and by models alike. It remains to be seen whether overall token-usage continues to grow quickly enough, and models become more efficient, to outrun the enterprise backlash that appears to already be unfolding. More heat and power cuts in London - 26 May 2026
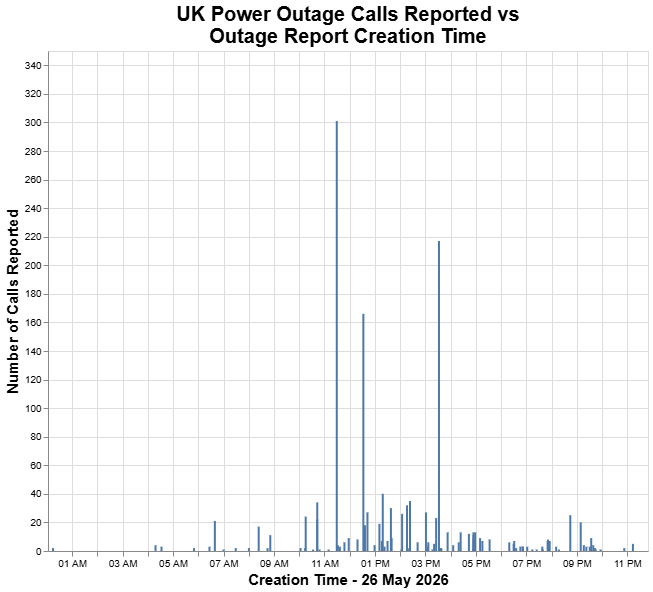
1Power cut data from UK Power Networks London broke its May temperature record for a second day in a row, reaching 35C. Incidentally, a tall building in central London was again part of an unfortunate urban block that suffered a power outage, and so additionally was without power, water, lift service and for a major broadband provider, without internet as well. Today however there were three cuts throughout the day affecting that specific postcode. And at one point in the day there were over 180 incidents (planned, unplanned or restored outages) listed on UK Power Networks. It is not immediately clear whether there is historical data or some other historical API feed available for the Live Outages but it would certainly be interesting to compare number of outages over different days, and also whether the heat had an impact. Of the “unplanned” and “restored” outages, they fell into the following broad categories, with “underground cable fault” and “network equipment faults” dominating. 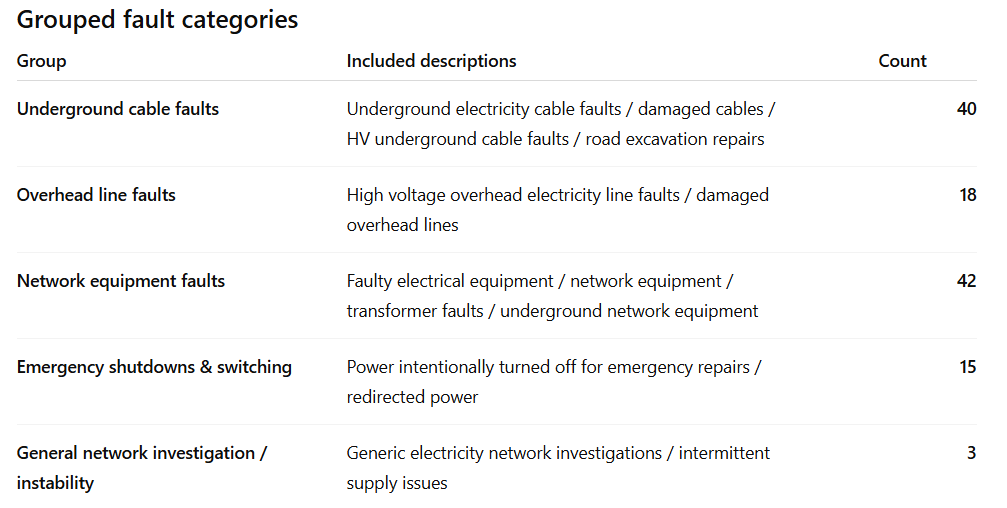
We wonder again whether the heat, or the power demand from e.g. airconditioning triggered these faults and if so whether any grid improvement or broader resilience planning will be forthcoming. We will certainly be monitoring that data source. London - Overheating in a Blackout - 25 May 2026The UK had its hottest May day on record today, with Kew Gardens hitting 34.8C. Incidentally on this day there were a few power outages in London, potentially unrelated. One of these outages affected a tall residential building in the City of London. This shut down the lifts. This also shut down the water for the higher floors. And shortly after that a large broadband provider reported an outage incident in that vicinity as well. In an instant, at least 50, perhaps 100, people in that building were suddenly without water, electricity, internet connectivity (excluding cell phones), unable to easily leave or return to their property and that in temperatures above 30C. The initial reaction to this is perhaps “first world problems!” But this is late May. Not July, which is the month that saw 40C in several places in the UK in 2022. The reality is that this is still a thing that the UK, in particular London, is woefully underequipped for. We wrote about the substation fire (sabotage) in Berlin in January this year that affected nearly 100 000 people and saw temporary accommodation set up for people because their heating was also affected. At least it’s not freezing at the moment. And of course, this heatwave may very well blow over so that the country can be enveloped in the mild, cloudy, drizzly 50 shades of grey that often passes for British Summer… But what if it doesn’t? What if London breaks 35C or even 40C again this year, and does so several times? For days on end? With so many people still working from home in the UK, particularly in London, an unusually hot summer could see a significant increase in airconditioning power consumption. In addition to the ongoing pressures of aging grid infrastructure, increased electric vehicle usage, electrified heat pumps, renewable intermittency, the additional electricity consumption from residential airconditioning going fully mainstream might just push the grid beyond its limits this year. What then? One need only look at the case of South Africa - a case study like no other, in which rolling blackouts caused by poor planning, maintenance and frequent sabotage, spurred huge residential investment in solar PV backup power systems. Of course the UK is notoriously not nearly as sunny as South Africa so blackouts might not lead to a massive solar deployment but it is a very quickly deployable decentralised power source. But such blackouts could foreseeably increase demand in the following sectors:
If you are suddenly without water, electricity or connectivity at home, for an extended period of time even if intermittent, then your first port of call would likely be the office or coworking space that might be able to provide economies of scale alternatives where individual cost is too high or impractical. We are conscious this resembles a bit our “end of the world” basket which we looked at early in January. And which, ironically, has probably significantly outperformed our actual portfolio. We wonder whether derivatives on solar panels or used EV batteries might be a useful financial instrument. It should not come as a surprise that the organisations best prepared for utility (energy, water, communication) disruption include the hyperscalers. Vast data centers that host high-fidelity abstractions of the entirety of human knowledge, increasingly powered by on-site power generation, satellite communications technology (at least in the case of SpaceX/XAi and of Amazon with its Blue Origin and Kuiper plays) - these behemoths are increasingly vertically (and horizontally) integrated and could very well continue to outperform in an overheating world. Tomorrow is forecast to be even hotter than today and may well set another heat record in London and the UK more broadly. And given that today was a public holiday, trains and data centers were probably not working as hard as they will be tomorrow. We hope this does not cause disruption. But we wouldn’t be surprised if it did. The State of AI Part 2 - The AI Productivity Landscape - 14 May 2026The enterprise investment case for AI relies fundamentally on the assumption that using AI technologies makes companies more productive. Goldman Sachs points out that consumer adoption of AI has been “spectacular” but that most of those users are accessing a free version, citing a Standford study which found that Generative AI reached ~53% adoption within three years. Covello notes that an “orchestration and deployment layer” needs to be added between enterprises and model developers, that data needs to be structured and deployed properly. This sounds effectively like reducing technical debt - a task which is notoriously laborious and painful for humans, and tends to provide little short-term return (which is why it accrues in the first place). At worst, companies will simply fail to do this and thus ultimately fail to reap the rewards. At best, it will be a rather brutal forensic audit job for whoever is unlucky enough to get tasked with it within the company. Perhaps this is where the Deployment Company (and others) comes in - will they be the ruthless “consultants” brought in to get enterprises more AI-ready? We previously expressed the view that it was more likely that SAAS (and consulting) companies would partner with model developers/hyperscalers rather than be driven entirely out of business by them. Thrive Capital (Joshua Kushner’s fund that is heavily invested in AI) has invested $100 million in Shopify, betting that AI could contribute to gains in commerce; Shopfiy was trading up around 4% later. Given recent examples of unrealised equity gains contributing massively to big tech earnings, it makes even more sense for the AI financial--industrial complex to partner with downstream companies - the mere act of announcing a partnership or investment may be worth the cost of the investment. AI Productivity Research A number of leading research institutions have published research on the impacts of AI on productivity. Published in the QJE Erik Brynjolfsson of Stanford, and others, find customer service agent productivity was improved with generative AI. Erik’s contributions to the field stretch beyond the academic, as the cofounder of Workhelix, which raised $15 million to “better understand and monitor AI automation at their companies”. Another widely cited study was done by the London School of Economics and found that AI saves the equivalent of one workday per week. The report was sponsored by Protivity, a consulting firm that provides audit services. It was formed in 2002 when Robert Half hired over 700 former Arthur Andersen audit employees, the firm which collapsed in the wake of the Enron scandal. Questions for the Future
Hantavirus We’re increasingly following news related to the Andes/Hantavirus outbreak. Given the public health nature thereof it seems unwise to speculate about it, particularly at this stage. However it is promising that transmission “primarily occurs…during prolonged close contact with an infected individual in the prodromal part of the disease”. The Telegraph noted a study today which found that the virus could survive in human sperm for up to 6 years. Could a “parallel pandemic” (a contradiction in terms) or epidemic emerge from this - a situation in which a virus spreads relatively widely across a population but remains confined to certain parts of the population? Given the nature of the transmission, could this suggest that contact tracing may return but be limited to people with whom one has had…”prolonged close contact”? Markets certainly do not seem to be too concerned about this at the moment. Nebius - Another “adjusted net profit” story Nebius reported blockbuster earnings earlier this week and was up over 20% at one point, trading at nearly $220. The major headline figure was probably that revenue had grown from $51 million in 2025 to $400 million in 2026 - nearly 700%. But certainly some of the market reaction must have been due to the gigantic increase in net income. $780 million of net income contribution was made by “gains from revelation of investments in equity securities”. ClickHouse, on of its investments, was valued at $15 billion in a funding round in January 2026. It is possible that, at some point, if the market starts to punish companies that relied on “unrealised gains from equity investments” to pad income statements and earnings per share numbers, that a company like Nebius might suffer for it. Of course, one assumes that Wall Street and the rest of the investor community are wise to these practices. But in this frenzied AI-induced semiconductor rally, what are people really paying attention to? The State of AI Part 1 - Token Maxxing & Goodhart’s Law - 12 May 2026Token maxxing is a “metric used in an attempt to track productivity in the workplace especially for those using Artificial Intelligence” according to Wikipedia. Using this as a metric for productivity is risky for many reasons, one of which is that it might be relatively easy to “game” - that is, to spuriously inflate one’s token usage in order to generate the impression of greater productivity. Hence, token maxxing. It is no irony that the Wiki page also links to “Goodhart’s law” which famously states that “when a measure becomes a target, it ceases to be a good measure”. We decided to look into which companies have been mentioned in the media for pursuing a “token maxxing” strategy. This includes companies that have been “accused” of inflating token usage, and companies that have been noted as using token usage as a metric of some sort, including employee productivity. Our hypothesis is that there are three potential outcomes for companies that do this and as a result for big tech companies that produce AI more broadly:
FT reports that Amazon staff have allegedly been using an “AI tool for unnecessary tasks to inflate usage scores”. Some employees said colleagues were using an in-house tool to automate “additional, unnecessary AI activity to increase their consumption of tokens”. We reference some content from a Reddit post on token maxxing at various companies earlier this week:
They go on to discuss the potential aggregate overestimation of token usage in their post and we concur with some of their logic. It would certainly be insightful if there were an anonymous page where people could report whether this is a more widespread phenomenon than we realise. Perhaps this page could also report on things like how to maximise your token usage. Perhaps we’ll build it next. In other news, the CME is launching a futures market for computing power. It is interesting that the company which Nvidia replaced in the S&P 500, Enron, tried something similar about 25 years ago with “bandwidth trading”. Compute is obviously immensely useful, as was (and is) bandwidth. But perhaps a better, and less fraudulent, execution will make compute power futures trading work where bandwidth trading did not. The infrastructure, at least, is actually in place this time. The Price:Earnings (excl. Investment Income) Ratio for Big Tech - 11 May 2026
We first noted the phenomenon of big tech companies' earnings being inflated by unrealised gains in their equity holdings in a post on Nvidia and its Intel stake (which, if they have not yet sold it, has continued to explode in value), in late Jan 2026. This “phenomenon” has continued over the last few months, and much coverage has been given to Amazon and Google's recent earnings which were significantly boosted by unrealised gains in the Anthropic stakes. One risk here is of course that the gains from such investing activities may not continue indefinitely. A devil’s advocate would ask - why not? Don’t they already employ the smartest people? Perhaps this calls for other valuation metrics and ratios being used such as those adjusted for income from investment activities instead of the more superficial “earnings per share” or “price:earnings ratio”. Amazon Over a trailing 12-month (TTM) period Amazon’s earnings were around $90 billion at the end of Q1 2026. Adjusting for the ~$28 billion in non-operating income (much of which is due to unrealised gains in its Anthropic stake) puts it at $62 billion. Given ~11 billion in outstanding shares this produces an earnings per share of around $5.6 which puts the price:earnings ratio around at around 50, given a price per share of ~$275. Using the full $90 billion to calculate EPS puts it up nearly 50% closer to $8 and a PE ratio closer to 35. Alphabet For Alphabet a similar story emerges. TTM earnings were around $160 billion by the end of Q1 2026. With around 12 billion shares that produces an EPS of around 13. And with a market cap of around $4.8 trillion this produces a PE ratio of around 30. However when adjusted earnings for “other income” which included nearly $55 billion in unrealised gains on investments, a lower figure of $105 billion in earnings produces an EPS closer to $9 and a PE ratio closer to 45. Where to now? There are some reasons why these blockbuster earnings could continue - the best compensated (and therefore smartest?) people at these big tech companies with enormous balance sheets are now also effectively running large venture capital or hedge funds or each of the LLM companies may maintain sufficient market share and pricing power to transition from their earnings being driven by investment-related activities, to operating activities again. However we think the odds are better that some form of market functioning disruption occurs before then which could distort some of the prices in the AI supply chain and even if not, that this transition from investment to operating income will not be entirely smooth. We are increasingly short but increasingly (however incredulously) open to the possibility that the Trump administration might just pull off keeping this equity market at or near all-time highs into the midterms, with a schedule of potential deals and wins to announce. We will explore various explanations for this soon. For one, the Treasury General Account might have started draining partly due to tariff refunds as Flexport CEO Ryan Petersen reported receiving $137 million in tariff refunds, a source of potentially $10's of billions of liquidity being pumped back into the economy. Tax day taketh, tax day giveth back - 15 April 2026In a somewhat bizarre twist of fate, the Nasdaq 100 is now up 3% on the year, up nearly 15% since the low at the end of March, and closed at an all-time high. This also means that the highly liquid 3x leveraged Nasdaq ETFs like TQQQ are up nearly 50% in 2 weeks. A similarly liquid semiconductor ETF SOXL is up 100%. These are obscene numbers. Credit spreads have come down significantly. It all feels a lot like April 2025 - threats of calamity, a climbdown, and a faceripping rally. This begs the question - where to now? Do we continue to take out new all-time highs, do we chop sideways until the US midterms, or do we begin a descent down similar to 2022? There are quite a few factors to weigh up in the bullish-bearish debate at the moment, which we will do soon. At the moment, we are more inclined toward a 2022 redux. However we wouldn’t put it past the current US administration to send this market to further highs. On tax day We previously highlighted that going into April 15 tax day there would be a liquidity drain which would be positive for the US dollar and negative for risk assets. Of course, the war in Iran played a significant part in this dynamic. The US administration probably took some joy in this year’s selloff of equities that had been bought anytime after the April 7 2025 market lows - these would all have triggered less-than-12-month holding period income tax events. And would also thus be payable in the 2025-2026 tax year. Now that this date has passed, two other forces emerge: 1) for many of the buyers of the April 2025 lows, they are already in the “capital gains tax” 12+ month holding period window, and and taxes payable on these gains are also only due in a year’s time, 2) those same buyers may be holding out hope for an abolition or further reduction of capital gains tax, especially as the next tax day will be after the mid-terms. Credit spreads 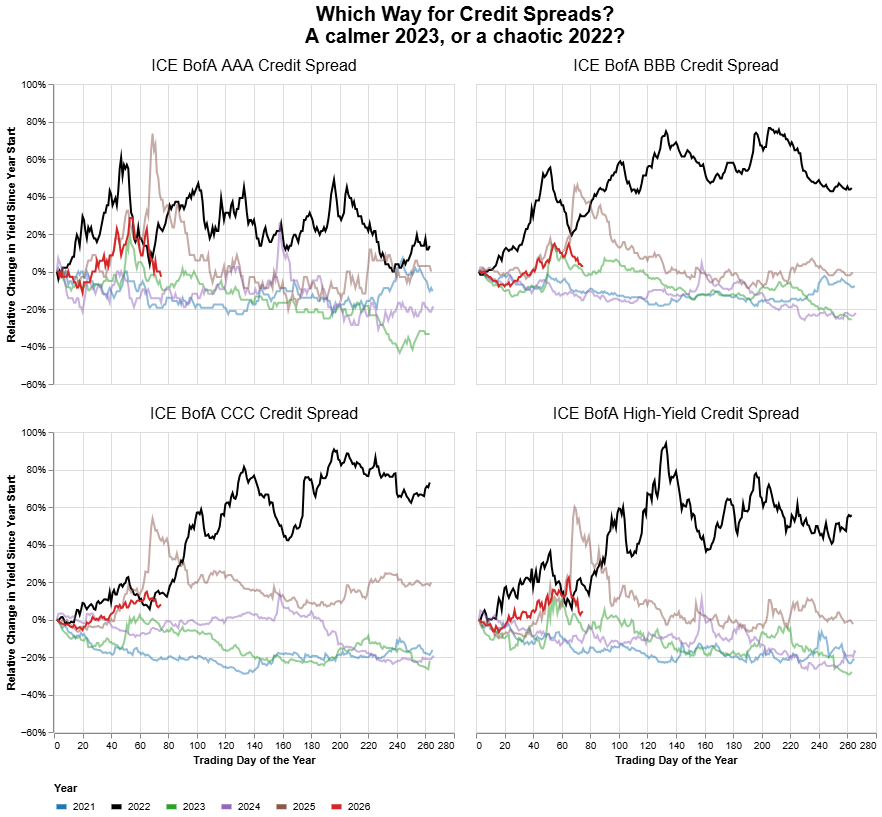
Credit Spread data fromICE BofA via St Louis FRED Credit spreads are down meaningfully. Normally this would signal an easing of liquidity conditions which is positive for risk assets. And there are a number of potential catalysts from the Trump administration, from the Federal Reserve, and from market conditions more generally, which could provide more support. But there is also a problematic parallel with 2022 to consider. CBOE Put-call ratios 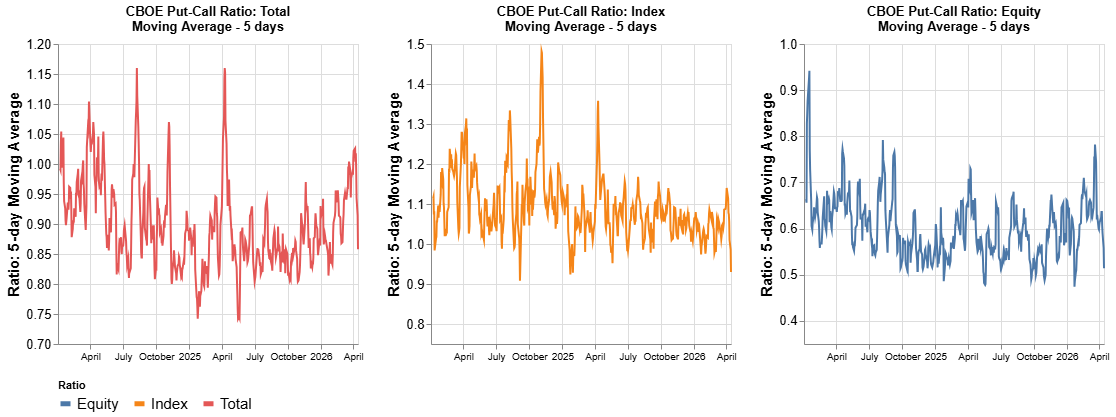
CBOE Put-call ratio data fromCBOE CBOE Put-call ratios have also collapsed. Having previously tested these it seems that sufficiently low PCRs tend to correlate with poor equity index performance in the days after that threshold gets hit. Equity index PCR hit the lowest level in 5 years this past week and the 5-day moving averages are reaching extremely low levels. Potential Short Squeezes or Falling Knife Capital? - 7 April 2026The TACO Trade Strikes Again A 2-week ceasefire, conditional on the Strait of Hormuz reopening, between the US, Israel and Iran was announced today. Oil was down -16% at one point and major US equity indices were up 2-3%. There is an eerie echo in the air in that the market bottomed around the 8th of April last year during the tariff turmoil. The day after that in 2025 S&P 500 gained nearly 10% in a single day. The “relatively” muted 3% gain (albeit after hours) suggests a somewhat more cautious market. European Shorts The FT reported today that hedge funds had made record bets against European companies. Top mention was Wizz Air with nearly 16% of free float short sold. Other companies include British brickmaker Ibstock, shorted by Citadel. The ceasefire announcement today might be enough to spur some unwinding of these shorts. We’re looking at taking a position in Wizz Air, although conscious that any meaningful bump could well be short-lived. Another sector that is starting to look interesting (only because it has crashed so much and because of the headline-driven market we find ourselves in) is UK homebuilders. We’ve been a long-time holder (sadly) initially entering positions during the mid-2022 slump post-Covid work-from-2nd-home boom. The major risk on this front would be that these companies go bust or are acquired at low prices before the cycle turns. The British Stocks and Shares ISA - Some dry powder The new UK tax year started yesterday (Monday 6th of April). What this means is that many people will have contributed as much as they could of their annual £20 000 allowance into their Stocks and Shares ISA (Investment Savings Account). And as a new tax year has started, it means allocations have reset. So it is likely that tens of billions of GBP are sitting in investor accounts, just waiting to be deployed. It remains to be seen whether the ceasefire is a sufficient catalyst for it. Past Results1 Do Not Predict Future Returns(?) - 30 Mar 2026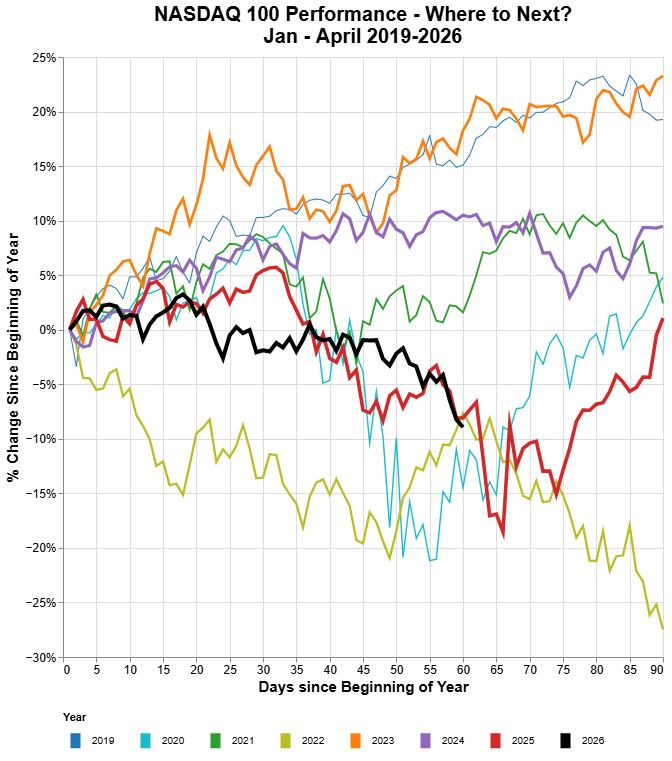
1Stock price data fromYahoo! Finance History may not repeat itself, but it sure does rhyme. The Nasdaq 100 has entered 10% correction territory since its October 2025 peak and is down nearly 9% year-to-date. There is a frantic search for historic parallels to glean what might be next. Is the current macroeconomic situation more akin to the tariff market turmoil in April 2025? Are we seeing a repeat of the 2022 tech drawdown after that bull market peaked in December 2021? Is this another market plumbing meltdown similar to March 2020 (but with geopolitical strife instead of Covid as the looming context)? Or are we seeing a broad-based deleveraging and systemic rupture more similar to the 2007/08 Global Financial Crisis, or a 2001-style dotcom bubble bursting? Tax day approacheth We reiterate the potential “calendar effects” phenomenon we mentioned earlier this year - many funds and individual investors deployed capital in April 2025 in the wake of the tariff market turmoil. Their 1-year/12-month “anniversary” is coming up. It seems likely that there are many investors who will have been spooked into selling by this current market meltdown in order to crystallize solid 12-month return figures. However there is another calculation individual US investors in particular must make - if they sell within a 12-month timeframe the gains will likely be taxed as income, rather than as capital gains. This is potentially a huge difference in return for an investor. Of equal significance is the aggregate potential tax for the US government. US equity markets since April 2025 have gained trillions of dollars in market capitalisation. It is conceivable that if sufficient individual investors who bought securities beginning in April 2025 have been pushed into selling those investments prematurely by the Iran war, the additional tax revenue generated by these sales triggering income tax events (as opposed to capital gains) could number in the tens or even hundreds of billions of US dollars. How many additional tax dollars are generated for each further percentage drop in US equity markets? Does this create a problematic incentive? Fannie Mae and Freddie Mac and Off-Exchange Markets Bill Ackman tweeted over the weekend that Fannie Mae and Freddie Mae federal home loan companies were particularly cheap. Both of these companies were up 50% by the end of the day. In addition to demonstrating again the power of social media platforms in driving sentiment for stocks, this event will likely also drive interest in and awareness of off-exchange securities trading. This fits with our narrative of increased trading on and interest in private capital markets. We have done evaluation of this company however we will assess and potentially invest in OTC Markets Group - the company that provides liquidity and price information for many over-the-counter stocks. Narrative Power - Iran On the topic of moving markets with social media - Iranian parliament speaker Mohammed Bagher Ghalibaf tweeted on Sunday that people should do the opposite of US President Trump’s social media posts seemed to indicate, from an investment perspective. And that pre-market “news” was just a “setup for profit-taking”. This sort of adversarial memetic conduct could have profound implications for financial market integrity. And it probably already has. Has Iran adopted the US playbook of viral diplomacy? Or of financialising conflict? Perhaps Iran is trying their hand at trading oil futures on the back of social media announcements... Long bonds, Circle Internet Drops on Tether - 24 Mar 2026The 30-Year US Treasury Yield The 30-Year US Treasury Bond Yield might be the most important number in international finance. It has bumped up against 5% a number of times in the last 36 hours. And on several of those occasions, and on two in a dramatic way, a news release has sent the yield falling. Most significant was yesterday when President Trump posted on social media about significant progress having been made in talks with Iran. Around 17:50 London time on Tuesday it was reported that the US and a group of regional mediators were discussing the possibility of peace talks with Iran as soon as Wednesday. And then later, very shortly after the close of US cash equities markets at around 20:20 London time, it was reported that Israel was going to announce a 1-month ceasefire. This sent the oil price and bond yields into (brief) freefall and, undoubtedly, wiped out a sea of leveraged short positions. Is the US Treasury conducting yield curve control, through public statements? This time, however, with inflation expectations (at least until the last few weeks) lower than in April 2025, it means that real yields on the 30-year treasury are even higher. Our guess is that this will likely remain a red line for them and so it seems likely that any time the yield approaches that level, one could likely expect some bullish statements from the administration. On the flip side it could very well be that current yields are sufficiently desirable for large and connected investors that we would not be surprised if treasury yields reaching a certain low threshold (around 4.9%) happens to prompt more escalatory headlines out of the administration… A Bad Treasury Auction - but for whom? The US treasury auction this afternoon prompted much discussion as well. A $69 billion auction of two-year notes faced weak demand from investors, and dealers had to step in to take more of the auction. The general consensus seems to be that this is a bad thing. But what if you were a dealer? Bidding for a 2-year treasury at an accepted high yield of 3.936% and then 3 hours later getting to offload it at a yield closer to 3.88%, sounds like a tidy profit. And if one was offloading much of the 20% accepted at that high yield (i.e. around $14 billion), this could mean an extra few million USD just in price-move. Not bad for 3 hours of risk (although admittedly that is forever in the current market). Just a reminder that in this environment, one is paid to hold risk. Let's see what happens at tomorrow and Thursday's auctions. Circle Internet Shares Fall 20% After watching Circle climb another infuriating 20% above our selling price from a few days ago, we watched with the rest of the world as this darling of the last few weeks which had climbed incessantly on days in the face of declines in virtually every other market, including in crypto itself, dropped a horrific 20% in a single day. This was purportedly on news that a draft version of US stablecoin legislation indicated that there would be limits on stablecoin yield. This should not have come as much of a surprise - banks are concerned about losing money to stablecoin issuers, and central bankers are concerned about deposit flight from a stability perspective. The other reason floating around was that Tether has agreed to submit to an audit by a US-based Big 4 audit firm, which it has previously not done. There has been some mystery around Tether’s collateral reserves including what exactly constitutes each particular category. One of the reasons we liked Circle was that it was an “American-made” more transparent stablecoin issuer. If concerns around Tether reserves are founded and they ultimately row back on the more transparent audit, much of Circle’s drop could be reversed. This feels a lot like a headline to fade and had that been the only major crypto news out today, we would have strongly considered re-entering at the current level of $100. Especially given the 4% yields (or more) it will be earning on its many billions of dollars of US Treasuries it holds as collateral. Looking ahead We are confident that if this conflict continues, continued energy disruption and high yields could potentially cause a dramatic contraction in economic activity through demand destruction and potentially elicit intervention by fiscal or monetary authorities that would put downward pressure on yields. The net effect of this, against the backdrop of an AI-fuelled reduction in labour demand, could produce the most dramatic fall in real yields we have seen in a very long time. We feel the global financial system will not tolerate much higher yields, unless they come paired with significantly higher inflation to temper real yields or an extraordinary productivity boost (which today’s data in the US does not suggest is happening…). There is just too much debt maturing soon and governments will struggle to refinance at even current levels, nevermind higher levels. There seem to be only two real outcomes here - much lower yields, not far from now, or a largely unrecognisable financial market. TACOs in Iran - 23 Mar 2026In the minutes before President Trump announced that productive talks with Iran had occurred, which sent the oil price collapsing and equities rallying, there was significant trading activity in S&P 500 and West Texas Intermediate oil futures. This has raised questions around potential insider trading, similar to administration social media posts in April 2025 shortly before a tariff reprieve was announced. Perhaps the less nefarious, but still likely market-integrity damaging, explanation was that it was the administration itself - e.g. the US treasury - that conducted some of these transactions. Either way this reflects a level of risk tolerance from the administration that concerns us - risk tolerance in governments tends to increase when they feel their time is running out. Also, in retrospect, this announcement should have been expected - long term bond yields had reached rather dangerous territory in the morning before. If this turns out to be “fake news” in that it does not represent meaningful progress towards a peaceful resolution of the conflict, we expect significant market turmoil to follow. It would not be the first time that bond market turmoil led to a climb down in negotiations. This, combined with the put-call ratio data we flagged yesterday, as well as positioning data which suggested that many market participants were heavily long oil, were all clues. CBOE Put-Call Ratios1, Fertilisers, and South Korea - 22 Mar 2026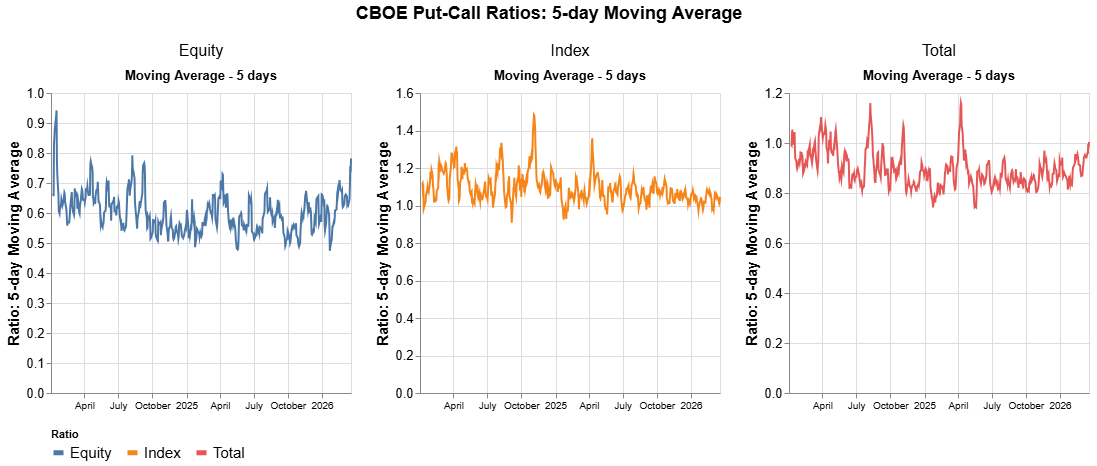
1Put-call ratio data from CBOE South Korea Much has been said recently about the world’s reliance on South Korea (because of the crucial role its two memory giants play in the AI boom) and thereby on South Korea’s reliance on oil, natural gas, and helium imports from the Middle East which supplies a huge amount of these to the country. President Lee has nominated Bank for International Settlements economic adviser and head of research Shin Hyun Song to be the next president of the Bank of Korea. South Korea’s total debt recently reached 6.5 trillion won, marking a record. Government debt to GDP, while not high relative to some other countries, also recently approached a record at 48.6%. Household debt to GDP is near 90% which is second only to Canada’s 100% in the IIF statistics. It will be interesting to see how the new central bank governor steers the Bank of Korea through whatever squall is gathering, with currency pressures, debt pressures, and a potentially catastrophic energy shock on the horizon (not to mention geopolitical pressures…). Perhaps with the government’s relatively low debt ratios, the government could print some debt and it might wind up getting effectively monetised by the Bank of Korea. In early trading the USDKRW breached 1511 to touch the highest level since 2009 and at one point the Kospi was down over 6%. Where’s that swap line? Fertiliser We have a non-trivial allocation to fertiliser companies and have held them for some time. And there seems to be an expectation that the next thing to rally in price could be fertiliser, as a consequence of the Iran conflict. However, fertilizer costs impact food prices and no politician wants that, especially in an election year (even if only mid-terms). It’s one thing to profiteer off of high oil and gas prices, but trying to do so off of fertiliser will likely be catastrophically unpopular. Hence we were not surprised that the US has softened sanctions on fertiliser, and also earlier in the month Bloomberg covered that the DoJ was probing the fertiliser market for potential price fixing. The kicker might be the fact that fertiliser company insiders sold shares quite early on into the start of the Iran conflict, which could suggest that they expect any price uplift to be temporary. We’re still holding, but we would not be surprised if more intervention came to this market. US Equities Market Outlook Total and equity CBOE 5-day moving average put-call ratios have reached their highest levels since April 2025. This has mostly been a contrarian signal - that is, when the put-call ratio is high, and the market is therefore well-hedged against a potential downturn, this often resolves in the opposite direction. This is partly because of vulnerability to short-squeezes - when a sudden positive price movement leads to aggressive buying (short-covering) which causes a positively reinforcing cycle. However much caution is needed here as, at extreme levels, this could also mean that options-sellers are exposed to a sudden downside move. We would not be surprised, however, by a short-term rally in equities here, potentially brought on by positive headlines on Iran. Hyperscalers and PE, UAE Brits Return Home, and South Korean Memory Chips - 17 Mar 2026Hyperscalers (OpenAI) - SAAS - Private Equity Collaboration We recently highlighted that it would make sense for SAAS firms to partner with hyperscalers rather than directly compete with them - partly because if the SAAS/private credit/private equity meltdown continued much further, it could take the broader market down with it, and partly because this way the hyperscalers could have a suitable distribution arm if/when the significant subsidies for LLMs are toned down and they are perhaps too expensive for individual consumer use. OpenAI’s recent announcement about a $10 billion joint venture with private equity to “bolster adoption of its AI software” suggests this is already happening The Great British Remigration UK Foreign Secretary Yvette Cooper indicated today that around 100 000 Britons had flown back to the UK since the start of the Iran war. Around 300 000 Britons are estimated to be in Gulf countries. If the war persists or escalates, we could see a significant portion of these citizens return to the UK. Many of them are holidaymakers but a fair few of them are likely high earners who moved to the UAE for tax purposes. A return to the UK could see many of them reside in places like London which would provide a significant boost to real estate demand. If the escalation is even worse and some of the Middle East becomes uninhabitable, for example because of radioactive contamination through accidental or purposeful nuclear involvement, this could trigger another refugee crisis. And, as it often the case, the wealthiest, most able citizens from there will be the first to leave and set up residence elsewhere. What happens when thousands, perhaps tens of thousands, of relatively wealthy people suddenly enter a city in which construction started on only 6000 new homes in 2025, 94% below the 88 000 per year target? South Korea We’ve been pontificating about the strategic importance of South Korea and its two memory chip giants Samsung and SK Hynix. We noted that Samsung Electronics' chip business CTO Song Jai-Hyuk resigned from the board, after joining the board only a year ago. Recent market gyrations in South Korea after the start of the Iran war has highlighted how sensitive the equity market and possibly the wider economy would be to a spike in the oil price or the US dollar. If the US had any more mercantilist or imperialist designs on this supply chain to secure Pax Silica, but with a stronger hand in it, it has extraordinary tools at its disposal - oil, the US dollar, and the might of the US military, in the event that North Korea’s recent missile launches prove to be more than just a show of force. If anything ever happens to these companies, the only major non-South Korean supplier of memory chips (Micron Technology) would likely perform very well. An interesting pairs-trade to implement this would be to long Micron Technology (which produces about 20% of the world’s memory chips and has its earnings call tomorrow 18th March) and short SK Hynix and/or Samsung. Gilt-y as charged - UK Real Yields1,2 - 16 Mar 2026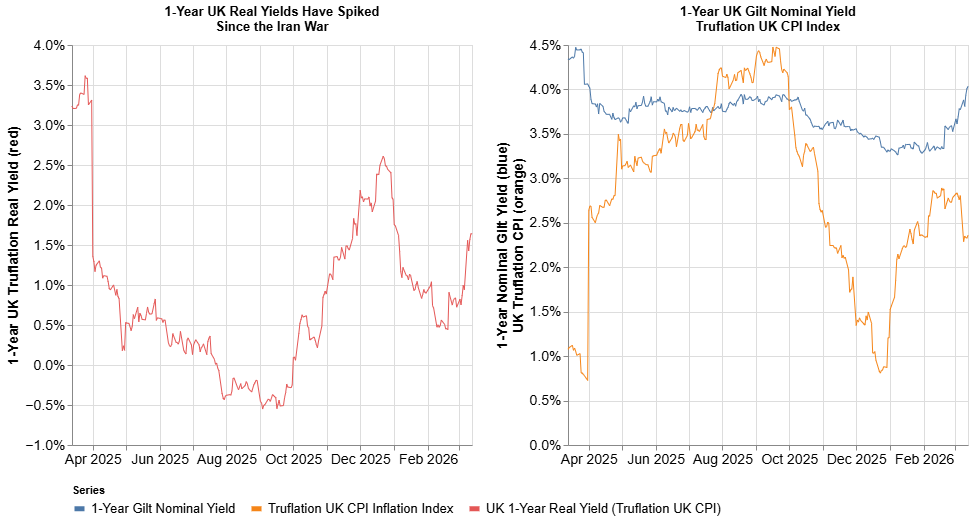
1Bond yield data fromMarketWatch 2UK Inflation data fromTruflation UK 1-Year Real Yields have spiked recently, driven partly by an increase in 1-year Gilt nominal yields and partly by a sudden drop in the UK Truflation CPI Index, and most of this drop was driven by disinflation in Food and Beverages, and deflation in Clothing. This looks to be one of the sharpest increases in UK nominal yields since their ascent from September 2024 to January 2025. Nearly all of the decline in yields since March 2025 has been erased in less than a month. The question arises again whether this spike in real yields is because of tightening liquidity or lending conditions, or whether it reflects expectations for a booming economy. Although retail sales spiked in January, we do not expect this surge in real yields reflects underlying economic strength. Is this time different?1 - 12 Mar 2026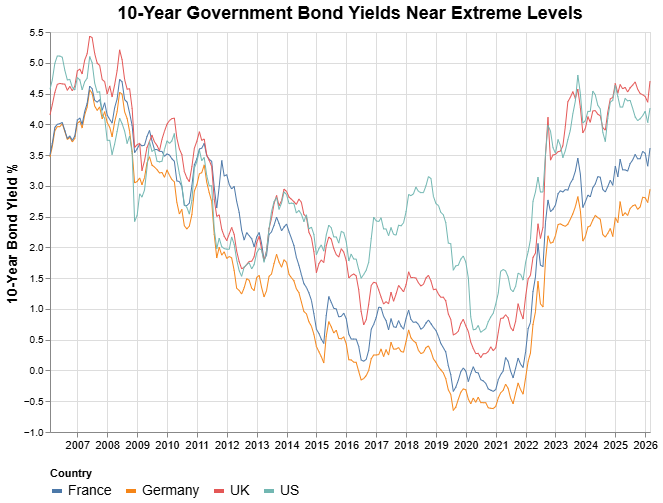
1Bond yield data fromSt Louis FRED Government bond yields have climbed back to recent highs. Credit spreads are at high. The US dollar DXY index is sitting near 100 (October highs). The 10-year - 2-year US Treasury yield spread is at October lows as well. US crude is still comfortably near $95. The USDJPY touched 159.50 yesterday and the USDKRW was back at 1495. Private credit and banking stocks have taken a beating since the start of the year. EURUSD cross-currency basis (a measure of funding stress or USD shortage) has started to flash. And there’s this issue with the war in Iran going on. There are a number of factors which could lead one to believe that something dramatic is going to happen in financial markets, soon. We are certainly close to critical levels which, if breached, could make things get ugly quickly. A couple of contrarian indicators suggests this might not be the case. The VIX has been elevated but indices have not realised commensurate volatility. CBOE Put-Call ratios have spiked higher recently (indicating more puts or downside protection has been bought). Volatility skew on major ETFs like SPY and QQQ is dramatically positive - heading towards April 2025 highs, another indication of more downside protection and that very few are positioned for a “right sided tail” or sudden surge higher in equity indexes. Dealer gamma exposure is negative for SPY which could promote continuation of rallies, and there’s a lot of positive gamma just below current spot levels, which could be counter-cyclical in a selloff. In many ways, the market is primed for a dramatic short squeeze. Any positive headlines on Iran tomorrow or over the weekend and we could see a violent rally. And so for those with narrative power the stage is set to ignite a brilliantly green close for the week. Perhaps a contrarian view to this contrarian view is this - with all this downside protection, and dealers and options sellers having gotten used to absolutely printing money when overly bearish or desperate retail traders have splurged on downside portfolio insurance for much of the last year, are the counterparties truly prepared for a downside move? What happens if there’s a catastrophic headline out of Iran, or a terror incident in a prominent city? Or any other number of potential black swans (we flagged the South-North Korea risk a couple of times in recent months)? What happens if put-sellers blow up, face margin calls, or have to sell other assets (like US treasuries) to fund their positive delta exposure? Of the various scenarios, a dramatic downside event does seem to be the most unlikely (based on the doctrine of “nothing ever happens”). But in our view, it is precisely because it seems so unlikely, because there is so much downside protection out there, that its risk might still be underpriced. There was also something else that caught our attention today. The CME Group chair Terry Duffy warned that the US government risked disaster if it intervened in the oil market via derivatives trading, as people could lose confidence in the market’s capacity to price commodities correctly. The article suggests there has been much speculation about the US government possibly being responsible for the large transactions over the last few days, giving some credence to our thinking that the US might be increasingly behaving like a large trader. One reason this caught our attention is that doing so seems incredibly risky in a number of ways, and would reflect in our view a dramatic shift in the Trump administration’s position, as well as a shift in risk tolerance. And risk tolerance tends to go up when you sense your time is running out or you expect some dramatic event in the near future. We still think the most likely path would follow the “nothing ever happens” route - relevant indexes and commodities would oscillate between key levels, not triggering any dramatic in-the-moneyness for either calls or puts, which would therefore expire worthless and options sellers would collect the vast mountains of premium that the market has been willing to pay this past couple of weeks. This would likely be paired with impactful headlines appearing near key price levels, pushing the relevant security away from that level. We saw a lot of this yesterday, with dollar-negative headlines smashing the DXY down repeatedly from around the 99 level (which, incidentally, in the absence of any such headlines it continuously reclaimed). The second most likely scenario is for a fair bit of upside, triggering some amount of a short squeeze and pushing major indexes into positive gamma exposure territory for dealers. And finally, a significantly negative market move tomorrow could prove disastrous if the magnitude was significant enough, as we don’t think bonds could take much more selling off before they triggered more systemic concerns. Narrative Power1,2 - 11 Mar 2026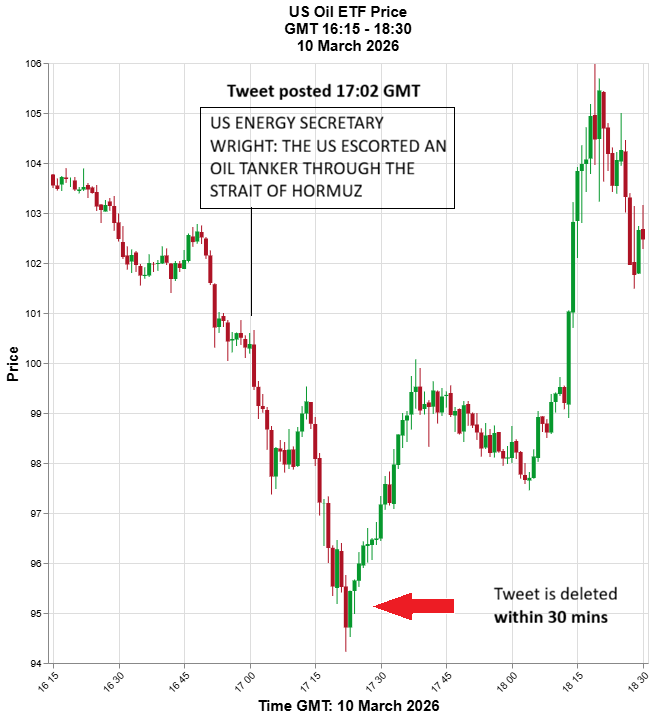
1US Oil price data fromMassive 2News headline data fromMKTNews Narrative power is the ability of stories, myths, and shape framing to shape reality and influence beliefs. In modern financial markets, it manifests in the ability of influential people to move markets with their words. President Trump did so famously in April 2025 when tweets around tariffs sent global financial markets reeling, and markets rallied after he wrote on Truth Social that investors should buy stocks. Last night narrative power rested with US energy secretary Chris Wright when he tweeted that the US had escorted a tanker through the Strait of Hormuz. Shortly after, oil prices plunged (shown above by the price of the US Oil ETF) and then rebounded after he deleted the tweet. Given the recent volumes in that and other oil ETFs, that move in the oil prices likely obliterated some leveraged positions and inflicted extraordinary losses (and gains) on holders. Oil Reserves Several countries including the US indicated today that they would deploy significant reserves from their strategic petroleum reserves. But it soon became clear that a specific timeline was not immediately available. For the US it would take approximately 120 days to fully deliver the Energy Department’s reserve. We would not be surprised if this and other actual deployment only started to occur at higher oil price levels than current, especially when looking through the lens of sovereign or “nation state" traders. Trader States And speaking of nation state traders, the Pentagon is allegedly recruiting from top tier investment banks for an “Economic Defense Unit” with the stated aim of “helping deter our largest adversary from gaining military superiority”. It seems President Trump’s dreams of a sovereign wealth fund are manifesting, in various forms. Given the amount of US debt maturing this year and the recent spike in credit spreads and US treasury rates of various tenors, perhaps the US is looking to not only secure critical minerals, but might be attempting to trade its way out of a fiscal deficit. The combination of the most powerful military, extraordinary narrative power, and a near-limitless balance sheet, surely would make for the most incredible hedge fund. It is worth remembering that US Treasury Secretary Scott Bessent was a partner at Soros Fund Management and is (probably) a trader in his bones. Other News: Section 301, THAADs in South Korea, Circle In “stories which we think may begin to dominate the narrative after Iran”, we highlight that the US is launching an unfair trade probe into 16 countries. Also, as the US has removed some of its THAAD batteries from South Korea to deploy them to the Middle East, we wonder whether this might spur North Korean aggression and posturing in the near future. There’s a huge amount of market capitalisation contained in the Kospi now, and the US would likely not look fondly on its flow of memory chips being disrupted. Definitely one to watch out for. Finally, we closed our Circle Internet Group Position today for a total gain of 50%. As per the usual contra-indicator this may well mean that most of its growth is yet to come. But the price action today looked a bit strange - with a gap to $122 on the open and declining to a low of around $113. We are still pro agentic commerce, stablecoins and the adoption thereof in general, as well as Circle in particular. We may re-evaluate and re-enter at a later stage, at a lower or even at a higher price. Neo-imperialism or just Neo-mercantilism? - 9 Mar 2026In a bizarre case of deja-vu, US equity indices finished the day higher on Monday than they closed on Friday, following a dramatic decline after Sunday night futures open. This follows an eerily similar pattern to Monday the 2nd of March after the first weekend’s strikes of Operation Epic Fury. Another episode of “Nothing Ever Happens” characterised by significant intraday and intra-index volatility but very little change in the index itself. A passive investor would barely have noticed. Oil positioning and flows - don’t get caught holding the bag It is becoming something of a trope that “retail investors” come into rallies near the end and are often left “holding the bag”. This might have been the case again as retail investors piled $82 million into the United States oil ETF USO. A huge proportion of this ($36 million or 42%) was done on Friday alone. This beats the 5-day record of $67 million in 2020 when oil price briefly turned negative during the Covid crash. Precious metals and equity ETFs saw significant outflows whereas energy ETFs saw extraordinary inflows. Oil did indeed spike as the conflict with Iran escalated dramatically over the weekend, with US and Brent crude oil trading up nearly 30%, towards $110 per barrel, triggering a restrike event for some leveraged ETFs. This brings the number of commodities underlying ETFs that have experienced restrike events this year to 3 (oil, natural gas, and silver), which we suspected would happen again. Given that oil proceeded to collapse from the day’s high around $115 to a low of $83 (-28%), and that many retail traders often access commodities and related funds with leverage, it is probably safe to assume that many of their trades were wiped out. Parsing current signals and rhetoric around the conflict is difficult, with some indications today that the conflict could be over soon. However there are still a few disruptions or escalatory events which we have not seen, which may yet come to pass - damage to AI datacenters in the UAE, potential radiation leakage from bombed nuclear sites, cyber incidents, or more severe aggression towards vessels trying to transit Hormuz.Any of these could be a trigger for another bout of volatility in equities and oil prices. Trader USA 2026 so far is showing that the Trump administration might be steering the US into not just a neo-mercantilist direction, but also into a neo-imperialist one. One of the themes we see emerging is that of “USA the trader” - that is, the US government more actively participating in markets. The markets that the US government has participated in so far include listed equity markets (e.g. MP Materials, Intel), private markets (Atlantic Alumina), strategic metals and rare earths (Export Import Bank loan to establish Project Vault), cryptocurrency (the crypto strategic reserve) One could add the strikes on Venezuela, which has vast oil and natural gas reserves the US can exploit, Iran and potentially Cuba as well soon (which has significant cobalt and nickel reserves). For the most part, these examples see the US government as a buyer (and a lender in the case of Project Vault). The latest addition to this phenomenon sees the US as a seller, in the shape of the Development Finance Corporation’s deployment of Maritime Reinsurance to secure up to $20 billion worth of losses. It will be interesting to see which “best in class” preferred American reinsurance partners will participate in the endeavour, and how the reinsurance backstop will be implemented. Fun fact: the current CEO of the DFC is Benjamin Black, son of financier and Apollo founder Leon Black, and was also previously a senior portfolio manager at Knowledge Universe (founded by “junk bond king” Michael Milken). Pax Silica - South Korea If Pax Silica provides any indication as to the priorities of the US government (in terms of resource acquisition) ensuring the continued supply of microchips (GPUs from Taiwan or memory chips from South Korea) likely ranks very highly on that list. Blackrock Financial Advisors already owns 5% stakes in both Samsung and SK Hynix. It would not surprise us to see US firms taking further stakes in this supply chain. But whether it occurs soon and near the current all-time highs of the Kospi, or later at more distressed levels, perhaps when a USD:KRW swap facility becomes necessary again, will give us some clues as to the intentions of the administration. There might have been some interim relief in the dollar shortage in Korea as the Swiss National Bank recently renewed the 10 billion CHF swap facility with the Bank of Korea, and it might be easier to turn CHF into USD. Weaponising the US dollar to secure a supply of components necessary for AI would certainly be a novel exercise… We wonder whether this practice will continue to characterise 2026 and the remainder of President Trump’s tenure - using the fiscal and military might of the US government for more active and aggressive resource acquisition. We suspect that this will almost certainly be the case. Private Credit, SAAS and those who wish to disrupt them SAAS has a near zero marginal cost, subscription windows that last some time, and in many cases produce products that many end-user companies would probably not want to insource or take responsibility for, and which hyperscalers and FAANGs may not want to develop robust versions of (e.g. HR platforms and possibly also CRM). We think it would be more likely for hyperscalers to ink deals with the SAAS companies whose share prices they have disrupted in recent months. Another important factor is that if the SAAS disruption continues for much longer, private credit’s downturn may deepen which could have knockon effects for credit spreads, employment and the wider economy. There is a real risk that a deep enough downturn could spread to other systemic financial market participants like insurers. If that happens, the wider equity market could very well follow. SAAS will become customers, rather than competitors, we feel. Private credit firms also likely do not want the SAAS downturn to continue, for the same reasons. But in addition to that, private credit lenders also do not necessarily all want to end up owning and operating the companies that they have lent to (which is increasingly the case, and looks set to continue). For those that have, and will, it would likely also make sense to (in addition to the relevant streamlining/efficiencies commensurate with such a takeover) engage with hyperscalers in a collaborative way, rather than a directly competitive way. On this superficial level, it makes sense for collaboration rather than disruption into oblivion to be the theme of the SAAS-hyperscaler relationship, which could suggest short and/or long term recovery in SAAS equity. There are crucial caveats to this however - it makes no explicit claims about the fundamental valuations, which many people (including Cliff Asness) seem to have questions about. The March-April Macro context We don’t generally give much weight to simple calendar effects in markets. But there are a few things happening over the next month or so which could have significant market impacts.
There is another somewhat vague calendar effect coming up soon as well. The 1-year anniversary of when the US equity market bottomed on the 8th of April 2025 is coming up. And while that itself is irrelevant, it does mean that any fund or investor that deployed capital during the downturn or in the early part of the recovery, will be setting their 12-month “performance” metrics soon, as well as potentially seeking to lock in the gain (which in e.g. the Nasdaq 100 has been an extraordinary ~50%). This could create further selling pressure. And given that the US has an extraordinary amount of debt maturing in 2026, and may have to refund $150 billion in tariffs soon, perhaps the IRS wouldn’t mind a bit of a selloff to act as the impetus for people to lock in their taxable gains, much of which might fall inside the 12-month holding window and thus be taxed at much higher rates. The Trump-Xi summit in early April is also well timed to be a potential catalyst for a market recovery, in the same way that the tariff de-escalation was a catalyst for the 2025 monster rally, if we continue lower from here first. More significant volatility ahead seems to be something of a foregone conclusion, with many potential sources of headline and event risk. The Kimchi Premium in South Korean Equities1 - 4 Mar 2026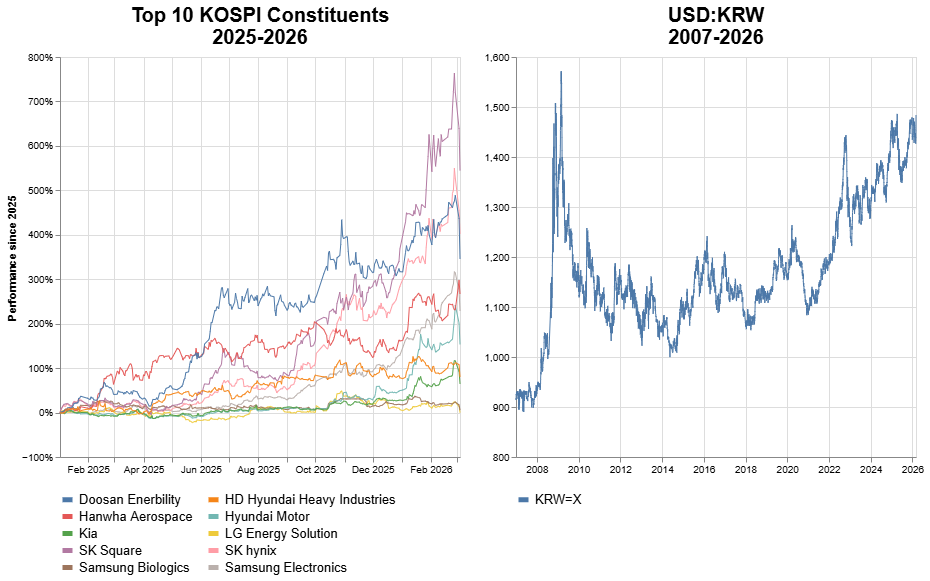
1Stock price data fromYahoo! Finance Kospi and USD:KRW Extreme Moves The South Korean Kospi equity index saw its worst day in history, falling 12% and triggering two circuit breakers. After which in the early hours of the morning, it hit limit-up again and triggered another circuit breaker. The USDKRW rate briefly touched 1510 last night before weakening back towards 1460. This level was the highest since the 2008 Global Financial Crisis. This and the Kospi’s recent performance are reminiscent of the USDJPY hitting 160 just before the Nikkei had its largest drop since 1987, in August 2024. If the parallel with Japan is to continue, this could mean some sideways trading for the Kospi from here on. It is also notable that the USDKRW dipped significantly after hitting the 1500 level the first time, before it hit a new high in 2009 around the time US stocks bottomed. While much of the gains in these stocks is undoubtedly explained by surging demand, it is worth remembering that the economy contracted somewhat in Q4 2025 and has previously led other economies. Kospi Leaders Although South Korean companies like Samsung and SK Hynix have been major beneficiaries of the AI spending boom, particularly due to increased memory costs, it seems the biggest gainer since 2025 has been SK Square which is, amongst others, the holding company of SK Hynix and part of SK Group the 2nd largest conglomerate in South Korea. Fun fact, according to Wikipedia the CEO and Chairman of SK Group is Chey Tae-won, who was previously married to the daughter of former South Korean president Roh Tae-woo, and was found guilty of embezzling $40 million to cover up his trading losses and sentenced to 4 years in prison. The current president, Lee Jae Myung, who has been indicted various times, was once a day trader himself and has prioritised boosting the South Korean stock market. USD:KRW Swap Lines In October 2025 South Korea and the US were discussing setting up a bilateral exchange swap agreement, so that its currency markets would not be skewed by the proposed $350 billion South Korea had promised to invest in the US as part of a trade deal. Supporting this deal will be put to a vote on March 12. The South Korean minister for economy and finance Koo Yun-cheol indicated that the US had rejected a cross-currency swap, as South Korea reportedly held nearly $1 trillion in foreign reserves. Perhaps part of the reason for denying this swap line was that it would signal crisis conditions, or weaken US leverage against South Korea in enforcing a trade deal. Or perhaps the US wants to become an exporter of memory chips through Micron. Given that President Lee has recently indicated the FX and stock market volatility need to decrease, it will be interesting to see how this needle is threaded - USDKRW is at near-record highs, the Kospi recently had its worst day ever (and is still up significantly year-to-date), they need to start making investments into the US, and may need to use US dollar reserves to intervene in their currency markets. DeFi, Real Rates, Private Credit1, Iran - 3 Mar 2026
1Stock price data fromYahoo! Finance Perpetual Futures US Commodity Futures Trading Commission Chairman Mike Selig said today that his agency was close to announcing policies that would facilitate cryptocurrency perpetual futures trading. These could be announced within the next month. Project Crypto is the joint initiative the CFTC shares with the Securities and Exchange Commission, whose head Paul Atkins appeared with Selig today. He has previously spoken positively about crypto financial innovation like perpetual futures trading. Hyperliquid, Aster, Lighter and other DeFi protocols, exchanges and tokens could potentially benefit from regulatory clarity. We have taken small positions in these and other related tokens. Our main concern here is whether this regulatory narrative is going to turn out to be more of a "buy the rumour, sell the news" phenomenon. Circle's ~100% price growth since the lows in February is starting to give us vertigo. Real Rates New York Federal Reserve president John Williams said today that two factors could justify rate cuts: maintaining a constant real rate and assessing whether policy should move closer to neutral. He mentioned that the Fed rate was currently modestly above neutral. We noted recently that real interest rates had climbed due to higher US treasury yields and somewhat lower inflation expectations. Unless inflation spikes, this would suggest forthcoming rate cuts to maintain real rates. Private Credit Blackstone’s flagship private credit fund has been hit with redemptions, seeing $1.7 billion in net outflows in Q1. Fundraising by retail investors has also slowed. Instead Blackstone management and employees had invested $400 million to cover redemption costs. Could this be a case of insiders buying at the bottom just as retail exits, or is this a desperate attempt to maintain confidence? KKR saw some insider buys by, amongst others, CEO Joseph Bay in mid-Feb which could provide some more support for this thesis (although worth noting that his net worth is estimated at $2.4 billion so perhaps this signal is worth less than it seems…). We also saw an interesting take on private credit, that it has higher reflexivity and becomes more correlated than equities during times of stress. In essence - if a borrower becomes stressed and has to refinance at a spread, this reduces free cash flow which leads to tighter loan covenants, which in turn causes the sponsors to reduce capital expenditure and lowers opportunities for generating cash flow. In this way, a lower mark-to-market for a private credit loan directly leads to greater interest expense. The question now is whether we are already seeing the manifestation of this reflexivity or whether this is yet to come. The major listed private equity firms (Blackstone, Apollo, KKR) are all down 40-50% from their highs. Indeed they are nearly flat since the start of 2024. At least once before (in April 2025) such a drawdown has been the bottom. But of course past results mean nothing. It would be deeply ironic, and all too typical, however for retail to have exited just as the cycle in private credit and equity bottomed. We’re entertaining this narrative and have taken a position in Blackstone and a listed private equity ETF. There is also the broader issue that insurance companies have become large holders of private credit and the financial system at large can ill afford these institutions coming under stress. This makes the next few days crucial for private credit, and in turn possibly for the wider economy and financial market. If the quadruple whammy of higher bond yields, wider credit spreads, and a stronger US dollar, against the backdrop of potentially higher energy costs, does not resolve relatively quickly and substantially, we could be in for a deeper correction than we’ve already had. Iran A few things today are worth mulling over here. We’ve noted repeated headlines stating that “no elevated radiation levels” were detected after Israeli strikes on nuclear sites, over the last few days. Something about how this is being conveyed makes us expect that we’re going to see a headline in the next few days that radiation levels have spiked somewhere, if significant airstrikes on these sites continue. Another perhaps unconsidered consequences of the conflict in the Middle East is capital flight out - high net worth individuals had flocked to UAE in recent years, including British citizens, and if this conflict persists or worsens with greater Iranian response in nearby countries, this could drive many of these residents back to relatively safer havens. Noteworthy, again, that this may occur before the tax deadlines in both the US (15th April) and the UK (5th April). As far as the UK is concerned, such capital repatriation could have notable impacts on residential real estate markets, particularly in the context of a record-low homes under construction (source). In conjunction with the Renters Right’s bill, which is widely considered likely to have negative impacts on the supply of rental properties to new tenants, this could potentially squeeze rents higher. We’re tempted to say the worst is over on Iran uncertainty. But the VIX and US crude is back down to below where they printed when markets opened on Sunday night, and the Nasdaq 100 is trading slightly above where it was then. A classic case of “Nothing Ever Happens” and a reminder for retail/day traders to stay far away from this market. But this seems too easy. There is still a slew of potential bad news that could come out of the Middle East - any indications around nuclear weapons development, or a radiation leak, a cyber attack, or a domestic terror event as retaliation in the US or UK could all serve to suddenly heighten volatility. The only question is whether initial volatility has now calmed down and the Iran situation will recede somewhat into the background. Goldilocks or Nothing Ever Happens - 2 Mar 2026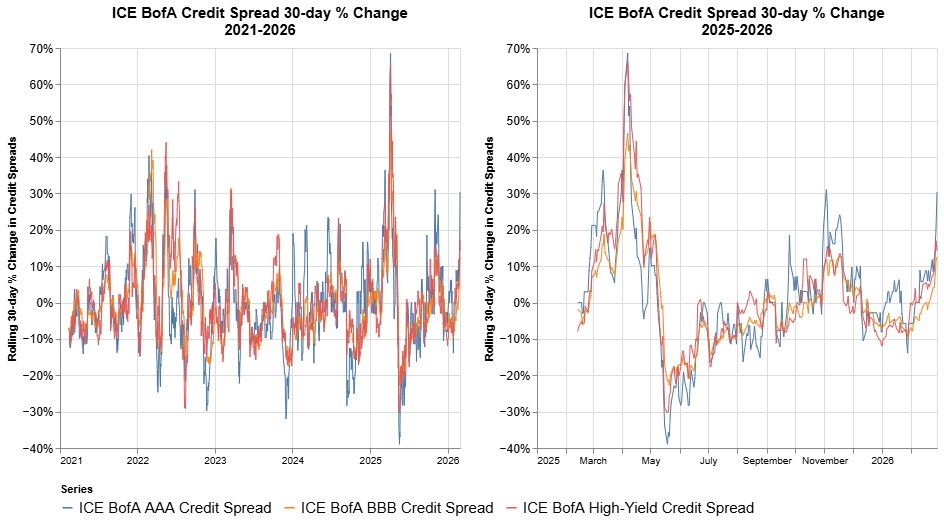
1Credit Spread data fromICE BofA via St Louis FRED In today’s edition of “Nothing Ever Happens”, broad equity markets (e.g. Nasdaq 100) somehow closed up from Friday’s close, despite a significant US and Israeli attack on Iran. Oil and natural gas were up only modestly. Yet another day with significant intraday volatility which was a dream to a market maker, a nightmare to an unsophisticated retail day trader, and really rather boring for the long-term buy and hold get-long and carry on investor. This leads us to believe that the broader market pressure on these commodities could be downwards. And in the absence of further escalation, we would expect prices to moderate. Indeed, lower oil and gas prices (despite the US being a net exporter and therefore gaining energy revenues from higher prices) would feed into President Trump’s agenda of lowering prices and seeing interest rates follow suit. If or when a new Iranian regime emerges and sanctions against them are dropped, oil and gas exports from the regime could help push down prices just as warmer weather descends on Europe and North America. We cannot help but wonder at the seemingly easily thwarted initial Iranian response, for having their supreme leader and much of their senior leadership wiped out. It seems too good to be true that this was a “one and done” operation. Indeed the response may have been something of a fact finding mission - a test of the air defense of various other Middle Eastern countries as well as that of the US. There also exists a great asymmetry in that estimates of a Shahed drone’s cost range from $30 000 - $50 000 whereas a THAAD interceptor costs $13-$15 million. Also in President Trump’s address today at the medal of honor ceremony, he mentioned that they’d planned for 4-5 weeks but because they’d managed to get rid of senior leadership quickly, they were significantly ahead of schedule. The US State Department has also issued a “Depart Now” warning to Americans in more than a dozen Middle Eastern countries. Iran also operates submarines and could potentially damage communications or other energy infrastructure, in addition to US naval vessels in the area. One other concerning headline we saw related to Abu Dhabi’s largest bank experiencing internet and mobile banking difficulties, potentially related to a cyber attack. Iran has very sophisticated cyber attack capabilities and so disruption on this front could also be expected. Israel’s destruction of Iran’s state broadcaster might also suggest intentions of more widespread attacks. Asian countries are particularly exposed to Middle Eastern oil and disruption in the Strait of Hormuz could potentially have particularly adverse consequences for Asian semiconductor manufacturers (and their stocks). Secondary Narratives We also think it’s always worth maintaining a broader context and considering narratives that are not getting much airtime when an event like the strikes on Iran is absolutely dominating media coverage.
We are starting to get a bit cautious on crypto or more specifically with crypto companies at these levels - Circle Internet is up nearly 100% from its $50 low just a few weeks ago. On credit spreads - the ICE BofA credit spreads are surging but what is interesting is that the largest change is from AAA credit. One potential take on this is that as some of the more dramatic market events (March 2023 banking crisis, August 2024 Yen carry trade unwind, April 2025 tariff turmoil) happened amid a backdrop of significant co-movement - yield spreads were blowing out across the risk spectrum, led by high yield spreads. On the other hand - the March 2020 turmoil saw AAA spreads proportionately blow out the most… We’re also conscious of the fact that the April tax day black hole still looms and that US equity markets may still be particularly vulnerable to draining liquidity and event risk. Unless there is little to no escalation, and the US manages to stabilise or reduce energy prices through this strike, we’re struggling to see a catalyst for a move higher in broader equity markets. One thing is for sure, if markets turn down from here, anyone looking back at this juncture will likely scoff at the hubris of not taking some risk off or putting on some hedges at these levels. Hyperliquid1 - 1 Mar 2026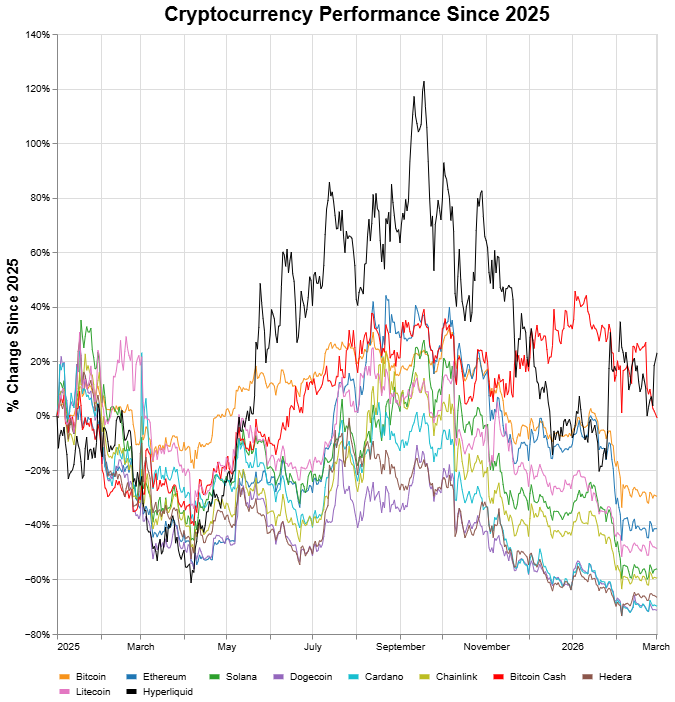
1Crypto price data fromYahoo! Finance Hyperliquid might just have had its moment in the sun. And there’s probably no going back from here. Market participants desperate to hedge or speculate commodities, particularly oil, prices over the weekend had the option of trading crypto perpetual contracts on the Hyperliquid exchange. Weekend markets on some brokerages were indicating that Brent crude prices could open up 16% on Sunday night. By around 01:30am on Monday oil was up only 4.5%. Much could still change by market open, but it seems like any market participant who was reliant on typical exchange hours (opening e.g. 08:00 London time), might miss most of this volatility (for better or worse…) Hyperliquid has an interesting pedigree. Founded by Jeff Yan, previously at Google and Hudson River trading. The largest publicly traded Digital Asset Treasury (DAT) company that has a significant holding of HYPE tokens (Hyperliquid Strategies) has former Barclays CEO Bob Diamond at the helm (who incidentally had his employment terminated in 2012 amid Barclays’ role in the LIBOR scandal). The notional volume traded on the platform, partly due to the high leverage enabled, is extraordinary - hitting $2.4 trillion. HYPE has weathered the downturn in the wider cryptocurrency market very well. Of the 10 major cryptocurrencies in the chart, only HYPE is up since 2025. We have acquired some HYPE and are considering adding an equity position in PURR as well. Oil and Natural Gas We hold a 3x leveraged Wisdomtree oil exchange traded product and are considering selling it at market open. There is certainly a chance that the recent attacks in Iran escalate which could push oil prices even further but we’re somewhat cautious after the very mild market open reaction in natural gas. Unless there is further escalation, we’re inclined to see this as bearish for oil and energy prices overall in the short to medium term, which would support President Trump’s agenda on inflation. The year so far in the Nasdaq 1001 and Nvidia earnings - 25 Feb 2026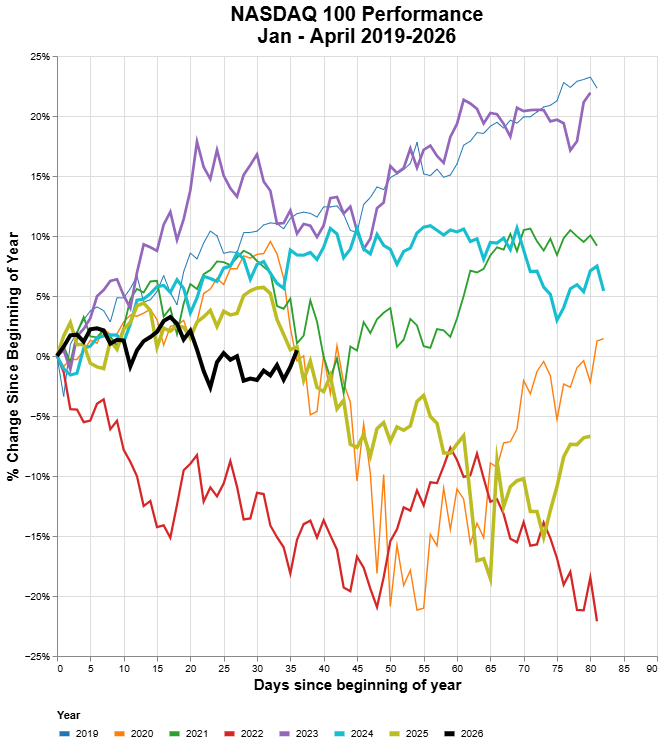
1Stock price data fromYahoo! Finance It feels like we’ve had a tumultuous start to the year in financial markets. In reality, this is the least-trending environment we’ve had since at least 2019. The Nasdaq 100 is essentially flat, up 0.5%, year-to-date. And yet we’ve seen the SaaSpocalypse, tariff tensions, extraordinary volatility in commodity prices, record one-day flows for several ETFs, and significant geopolitical posturing. We suspect, however, that when one looks underneath the hood you’ll find 1) dramatic within-index volatility and 2) higher intraday volatility. The latter is ultimately where option-sellers tend to make more money - relatively elevated (but contained) implied volatility means that options are expensive, but low realised volatility, especially for certain timeframes, means that options expire out of the money. In short, the market thus far has been great for 1) buy-and-hold index investors, 2) market makers. And far less so for punters betting on large outsized moves. Where we go from here is anyone’s guess but it seems bizarre that after all this intraday volatility, we’re not only flat 2 months into the year but we’re crossing the 0-threshold as we did in 2020, 2021 and 2025. Nvidia Q4 2025 Earnings As far as Nvidia earnings were concerned - our “concerning case”, in which income was elevated but revenue or margins were worse than expected, did not come to pass. However the FT cites their $43 billion in income without referencing the fact that it was boosted by $5.3 billion from realised and unrealised gains in their equity portfolio. Either they need to continue to show such gains on their equity portfolio (to put it in perspective - the whole of Jane Street generated less income than that from their trading activities in Q3 2025) or their net income growth will stall. And it may become clear how much the market cares about profit growth, rather than just revenue growth. At the risk of banging on about it, we emphasise again the similarity between Q4 2021 Amazon and Q4 2025 Nvidia - insofar as investment-related income made up a significant part of their net income. Data is the moat Somewhat unrelated we will tentatively take the win for citing Circle Internet’s prospects late last night - at last count it was trading up nearly 33%, the overall crypto market up over 10% and various other crypto companies up significantly. It is worth some caution here in that stablecoin legislation, even if passed, will only come into effect several months from now. Finally we also celebrate (possibly prematurely) a recent 20% gain in another holding Thomson Reuters (TR), recovering nearly all of the February declines. We previously covered the possibility of hyperscaler activities driving traditional media higher through licensing and partnership deals and we expanded this view to encompass a broader notion - that of data being the ultimate “moat”. Tae Kim made the point that TR was the only place to get Westlaw data. Further to this point we’ve been thinking about whether the hyperscalers really can (or even want to) disrupt SaaS entirely or whether it would make more sense for them to partner directly with these companies. We think the latter is more likely and as a result we’re starting to wonder whether the death of SaaS, much like that of the dollar, has been greatly exaggerated. Part of the reason we believe this is that in the extreme, a company with sufficiently smart and confident people ultimately takes on some of the qualities of a hedge fund (they become traders or investors, effectively). That is, these companies will likely increasingly take equity stakes in the companies they may disrupt, or which may disrupt them. And then the smartest of these people will go on to found companies in the space their trading activity has identified as being the source of future growth (we're thinking of Jeff Bezos leaving DE Shaw to start Amazon and more recently Liang Wenfeng, co-founder of Chinese hedge fund High-Flyer, who also started DeepSeek) Nvidia1 and Stablecoins (briefly) - 24 Feb 2026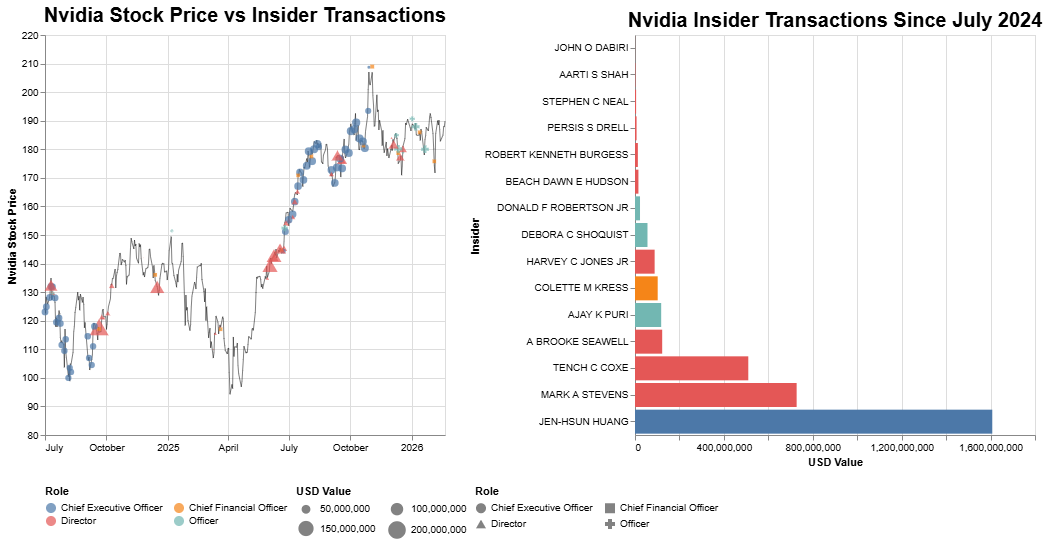
1Stock price and insder data from Yahoo! Finance Nvidia announces Q4 2025 earnings tomorrow night after the closing bell. And there is a sense that, again, the GPU-maker is carrying the US financial market, and the global economy, on its shoulders. Nvidia has tended to beat, and its share price has tended to go up after earnings. And the fact that its share price is barely 4% off the highs from October 2025 shows that Nvidia tends to go up, period. But where are the potential sources of beating expectations? We’ll focus on their equity investments. LSEG data suggests Wall Street expects Nvidia quarterly profit to grow 62%. Eyes will be on the gross margin, on guidance and perhaps in particular on capital expenditure plans. We’re going to be looking for a very particular scenario - where net income or comprehensive income, and earnings per share, are higher than expected, but revenue, gross margins, and/or guidance disappoints. The reason for that is twofold - 1) Nvidia is likely to show some impressive unrealised (and potentially realised) gains on its $13 billion equity portfolio which might juice the numbers, and 2) if that happens, we recall the Q4 2021 Amazon earnings event in which their windfall in the Rivian IPO dramatically boosted their earnings.. Nvidia faces an interesting incentive - announcing an investment from Nvidia tends to impact a company’s stock positively. The major source of potential unrealised gain is of course Intec, where Nvidia’s shareholding gained approximately $3 billion during Q4 2025. If treated as profit, this could easily represent 7-10% of Nvidia’s pre-tax income in that quarter. And, perhaps, the impact that could have on e.g. an earnings per share beat might be worth (at least temporarily) much more than $3 billion in market capitalisation. If this is indeed the case (if earnings beat expectations in part because of investment-related income) we wouldn’t be surprised if Nvidia ramped up its buying and investing spree. Witness, Nvidia the hedge fund. Stablecoins A lot has happened in the last week around stablecoins and payments:
There’s a fair amount to unpack here and we’ll do so later this week. In the meantime we are debating this - a surge in cryptocurrency prices, triggered by regulatory clarity and/or a significant surge in stablecoin demand/volumes, could potentially push the broader equity market higher. We have a position in Circle Internet Group, the second largest stablecoin issuer (USDC), which also reports earnings tomorrow. In short, a highly transparent and “American made” complement (or substitute) to Tether could be significantly undervalued at the moment (although this is crucially sensitive to the broader regulatory environment and in what form legislation under consideration might pass in the US). Which companies1 could gain from Supreme Court Striking Down Tariffs2? - 19 Feb 2026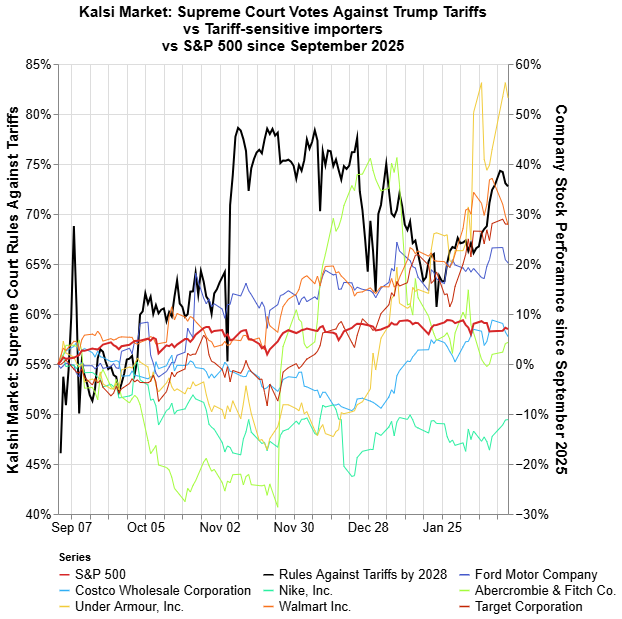
1Stock price data from Yahoo! Finance 2Prediction market data adapted from Kalshi Tomorrow the US supreme court could rule on the legality of President Trump’s tariffs. CBOE put-call ratios over the last week have spiked, suggesting market participants have been shorting equities or trying to hedge against a drop. Odds on Kalshi suggest that the supreme court is going to rule against the tariffs. If that happens tomorrow, there is a further question regarding whether 1) the tariffs should be refunded and 2) whether the Trump administration will find another way to reinstate levies. As far as market impacts are concerned there seems to be some consensus that the tariffs getting struck down would be good for stocks and could lead to a reduction in uncertainty. That seems like an oversimplification - if they get struck down, it seems likely that the Trump administration would respond with unexpected policy measures. What’s more, they have recently emphasised the record high levels of the market, and if the tariffs are struck down this could provide a handy scapegoat for any drop in equity prices, including for any of the administration's next policy responses that cause a drop in equities. In terms of specific equities which might benefit - there are a number of companies which have cited large tariff expenses in their earnings filings and calls. It is interesting to compare their performance over the last ~6 months (since the supreme court issued certiorari on the matter of the Trump tariffs on 9 September 2025) with the Kalshi prediction market for a ruling against the tariffs. If there is going to be upside from a potential ruling against tariffs, how much of that is already priced in? Another interesting factor that we’ve mentioned before - April 15 tax day as a liquidity drain blackhole. Funds entering the treasury general account leave the banking system and so paying taxes acts as a drain on liquidity, which could explain stock market declines around this time of year. But if the tariffs were to be struck down, and ordered to be refunded, this could well offset some of the liquidity drain. Domain registrars and Public-Private Market Equivalence - 15 Feb 2026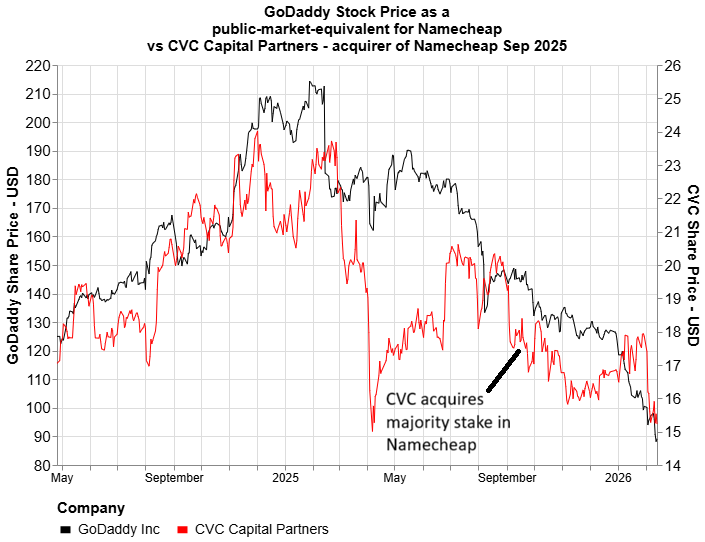
1Stock price data from Yahoo! Finance For a while, it looked like domain name registrars might be a big beneficiary of the vibe-coding phenomenon. At its peak valuation in Jan 2025, GoDaddy had a market capitalization of nearly $30 billion. It’s now down a staggering 55% to $12 billion in a single year, trading around $90 which is not far off the $75-80 range where it has traded for much of the last decade. Given that GoDaddy has a market share of around 30% of the domain market, and the second largest company by market share (Namecheap) was acquired by CVC Capital Partners in September, it seems a bit strange to us that their revenue has not grown more. Speaking of CVC - when this private equity firm acquired a majority stake in Namecheap for $1.5billion in September 2025, GoDaddy had already experienced some of its precipitous decline. However since then, it has fallen nearly 40%. If we were to assume that CVC took a ~50% stake in Namecheap (paying roughly $750 million at the time), and that GoDaddy was a good “public market equivalent” benchmark for Namecheap, and its decline did not reflect a loss in market share to Namecheap (which is a BIG assumption, admittedly), then the current potential drawdown in GoDaddy of 40% would be equivalent to a roughly $300 million loss in value for Namecheap and its owner. The flipside of course is that Namecheap could have made up some or all of the market share loss from GoDaddy, and CVC could be sitting on an unrealised gain. Unfortunately determining that would require quite a bit more analysis. In the meantime, CVC market cap is down about 15% or $2.5 billion since then September 2025, likely another victim of the SaaSpocalypse. This makes us wonder - why is the largest domain registrar not benefitting more from the supposed vibe coding explosion? Or, does it still stand to benefit but it is also suffering, potentially unfairly, from the negative sentiment around SaaS, in which case it might be undervalued? Or has the rush to register domains for future vibe coding projects slowed down? Private Credit and Software There has been a fair bit of coverage of private credit and software in recent weeks. The FT recently highlighted the sheer magnitude of the software exposure that private credit as an asset class has, with particular emphasis on Business Development Companies - typically listed providers of debt and equity to middle market businesses. Of the two largest funds (Blackstone Private Credit Fund and Blue Owl Income Corp), the first had around 30% of its loans to tech, most of which was made up of software companies. A Bloomberg article on Friday found that this might actually be an understatement - at least 250 investments totalling over $9 billion of exposure was made out to companies not classified as software companies, but considered software companies by other lenders. This makes it quite difficult for investors to assess true exposure. Dealmaking in this space also doesn’t seem to be slowing down yet with Bloomberg reporting Goldman leading a $3.5 billion loan for a buyout of Clearwater Analytics that valued the company at $8.4 billion - more than it has ever traded for publicly according to CompaniesMarketCap. A similarly large premium on recent public market valuation was afforded to OneStream in the take-private deal by Hg. It is certainly not evident where all of this leads - whether SaaS will continue to decline, and if so whether there will be knock-on effects or contagion of some sort to those who own or lend to these companies, or whether it will stabilize. Regardless of the terminal destination, we expect significant volatility and possibly a few short-squeezes before we get there. Indeed short interest for IGV stood near its highest ever last week. A potential catalyst for such could simply be clarity from some of the hyperscalers on whether they consider SaaS to be likely to be disrupted by their own technology (which, if the drawdown because of this disruption continues, might start to threaten the broader tech equity market). As we've mentioned before, we've dipped into some SaaS and we're now considering some of the BDCs. It's not immediately clear whether this would be a short-term play, if any. Accounting for irregularities - 12 Feb 2026We saw two interesting news stories the last two days that stood out. Today, ICON Plc, a clinical research organisation, revealed that it had launched an internal investigation into its accounting practices. This related to a potential revenue recognition from 2023-25 and a potential overstatement of revenue in 2023 and 2024 of less than 2%. It also withdrew its guidance for 2025 and would announce it on April 30 this year. Its stock proceeded to drop over 50% at one point today. Earlier this week it was Kyndryl’s turn. The global enterprise technology services provider announced that it was launching an internal review into its accounting practices, following an SEC request for documents around its “cash management practices, related disclosures, internal control over financial reporting, and certain other matters”. Its CFO and general counsel departed the firm as well, although this was announced earlier. It was also delaying its guidance. Its stock dropped around 55%, and dropped again today. “Falling Knife Capital” is probably looking at these stocks but also wondering whether there is more pain to come, or whether the drop is completely overblown. We’re curious whether we see more of these “irregularities” appearing, or whether this is confirmation bias for a view that there is something systemically fishy going on. Some more weakness in “bellwether” stocks1? - 11 Feb 2026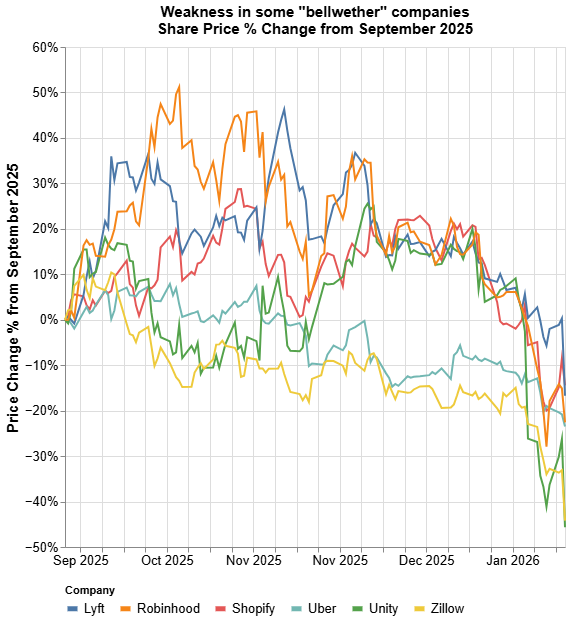
1Stock price data from Yahoo! Finance The US reported January labour data today. As we suspected yesterday, the US administration’s comments leading up to the release were too downbeat and the data surprised to the upside - jobs created came in at 130 000 over much lower consensus expectations, unemployment inched down to 4.3% and earnings grew 3.7%. The market response has been somewhat strange - an initial pop higher for the indices with the Dow Jones Industrial Average retouching its record high of 50500 and the Nasdaq 100 briefly back up to around 25350, before both going lower. Yields spiked along with the US dollar around the release time and market open, so the move in indexes in dollar-terms was even more pronounced. But through the index noise there are a handful of stocks that have had interesting moves today. Some of these stocks reported earnings - Shopify, Lyft, Unity Software, Robinhood, and Zillow. At one point today all of these features on the Yahoo! Daily losers leaderboard but some have since recovered. To us, these stocks have some characteristics of bellwether stocks. Some of their recent decline can be explained - Unity is probably down a bit because of Alphabet’s game AI engine as well as softer guidance, Robinhood has taken a hit because of crypto’s dramatic decline since last October, Shopify has probably taken some of the SAASpocalypse heat. But Shopify initially popped higher before dropping for an intraday max decline of over 20%. We found it interesting that Uber was down with Lyft, even though Uber had had relatively good earnings recently. We’ve lightly dipped back into Robinhood, Shopify and Unity. But we’re very cautious on these names still. Falling Knife Capital to the rescue? We closed our Generac position today for a gain of 40% since early Jan. It's already up another 2% since we sold... What could Corporate Bond Issuances1 mean for interest rate2 expectations?1 - 10 Feb 2026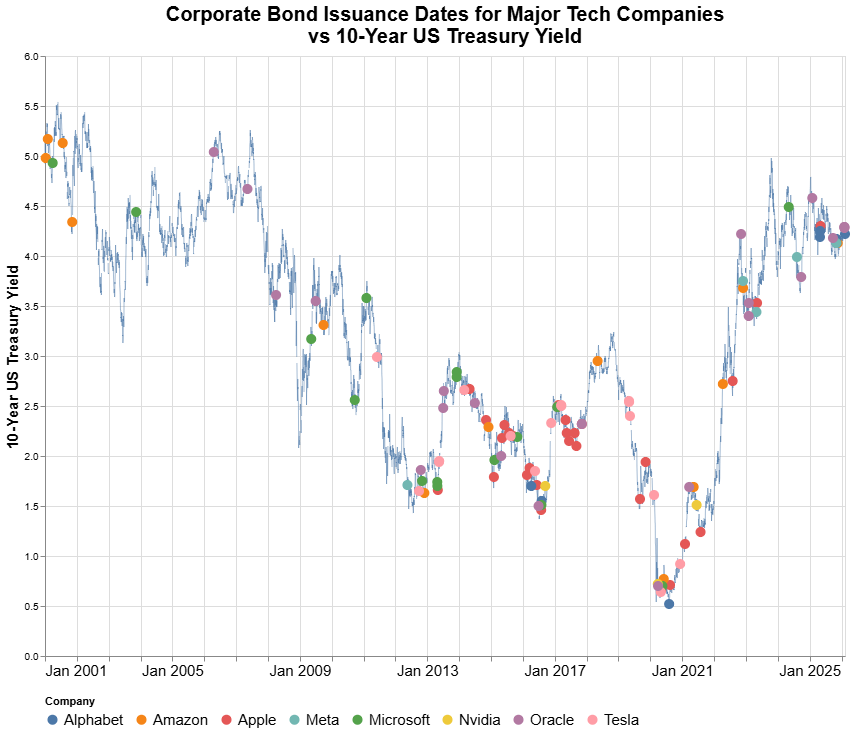
1Bond issuance data from SEC 2Bond yield data from SEC Alphabet’s recent bond issuance has made a lot of waves. They raised over $30 billion over the last few days, and their US dollar denominated offering attracted the strongest orders of any corporate bond issuance ever. Clearly Alphabet is confident in their extraordinary capital expenditure ambitions, and the market’s appetite for it seems boundless. This follows a similarly enormous raising by Oracle in the last week. And indeed over the last year, 5 tech titans (Alphabet, Amazon, Apple, Meta, Oracle) have tapped capital markets. As we’ve covered previously, Apple in 2025 tapped debt markets for the first time in 2 years. We also covered the question of whether the finance gurus who work for these companies have some clairvoyant capacity to guess whether interest rates are going to go up or down over the next few years, and therefore whether any given time was a good time to borrow. Why would a company borrow money?
Practically, these titans can raise funds at interest rates similar to US Treasury bonds and their interest expense is probably a relatively small portion of their total profits. But at the same time, they are raising billions of dollars of capital which means hundreds of millions of dollars in servicing costs every year - every basis point probably matters, especially if you're the CFO. So let’s focus on the last possibility. What are different ways in which it might become harder or more expensive? The main one would be if interest rates went up - either for these companies specifically, or for borrowers more broadly. But interest rates are not low right now. Indeed the 10-year yield is only about 80bps from its 15-year peak reached at the start of 2025. Which means that either these companies are not really sensitive to borrowing costs, or they are sufficiently strapped for cash that they need the financing now, or they expect interest rates to be higher a few months or years from now. Given that these companies are building out AI, potentially racing after Artificial General Intelligence, perhaps the cost of their debt doesn’t matter (or so they believe) because whatever they generate from these borrowings will far exceed the costs. Or, potentially more likely, they simply believe now is a better time to borrow money than in the near future. And if that is the case, we expected US equities, bonds, or the US dollar itself, is not correctly priced. We keep coming back to the US labour report on Wednesday. It seems that everyone is prepared for some dramatic downside. Something just feels off. We think it’s either going to be a bit of goldilocks - maybe decent jobs but with some softness in earnings growth, in which case US rates and dollar could probably resume their gradual recent softening. Or, we suspect, it’s going to be a blowout. Unemployment down, jobs up, maybe even earnings up. Yes, nothing ever happens. But tomorrow it probably will. Political contributions as a trading strategy 2.01 - 9 Feb 2026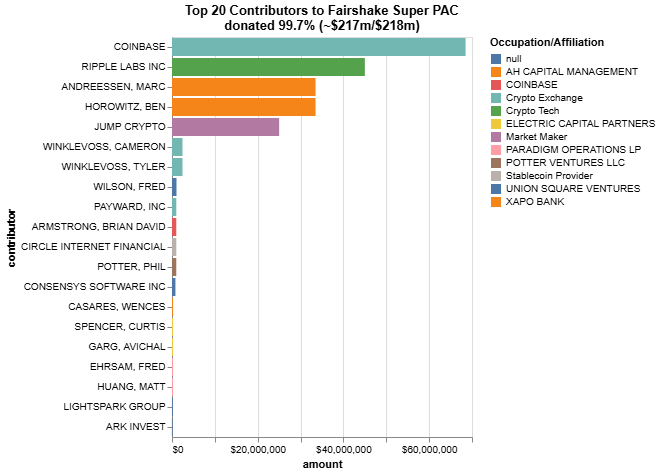
1Fairshake Inc contribution data from OpenSecrets Fairshake super PAC supported pro-cryptocurrency candidates in the 2024 US election and raised over $ 200 million during that cycle, according to data compiled by OpenSecrets. They’re also entering 2026 with a similar amount of money and are sure to support pro-crypto candidates. What we’re wondering is how much of the rally in crypto leading into the 2024 election, and subsequently, was pricing in this pro-crypto support. And whether the coffers can recreate that in a midterm election year. Week ahead There are two big data releases this week that could have significant market impacts - labour data on Wednesday 11th and inflation data on Friday 13th. Director of the National Economic Council Kevin Hassett said they expect lower jobs numbers. Which we feel suggests either the number is going to be really bad, or ironically surprise significantly to the upside - unlikely to be in between. At the moment we feel the market is probably preparing more for a downside surprise. The US dollar has come down a bit since Friday while treasury yields have retraced some of their fall. We’ve mostly been of the view that the dipping near-term inflation expectations, and the resultant spike in near-term real yields, have been because of hints of economic weakness. But what if it’s not? What if real rates are spiking because the economy is going to take off from here? There are admittedly a few near-term potential asset price shocks - one of the main ones being the liquidity black hole that is April 15 tax day in the US. But what if the data is better than expected, and the Trump administration manages to thread the needle just right - with ceasefire or peace deals with Russia and Iran, a meeting between Trump and Xi potentially as soon as the first week of April… A lot of ifs, admittedly, but if we can see a path higher for equity markets from here, they certainly can. We are not as positioned for the upside, for if the pain trade is higher, than we'd like to be... Political contributions as a trading strategy1 - 8 Feb 2026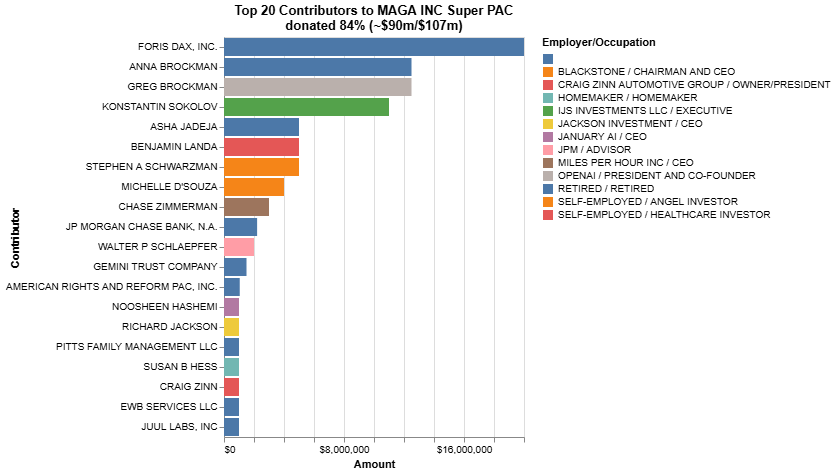
1MAGA Inc contribution data from Federal Election Commission Do more successful people and organisations donate more to political action committees (PACs), or does donating more make them more successful? It would be interesting to plot the fortunes, on an absolute and relative basis, of the significantly contributing organisations and people. We note that the largest single contribution came from FORIS DAX INC the parent company of the Crypto.com exchange. Fairshake, a crypto-focused PAC, raised several hundred million dollars during President Trump’s previous election cycle. The largest joint contribution, if taken together, came from OpenAI CEO President and Co-Founder Greg Brockman and his wife Anna Brockman. In the healthcare space, Nosheen Hashemi of January AI donated $ 1m as did Benjamin Landa of Sentosa Care. It could be useful to construct a hypothetical portfolio with exposure to these people and organisations and to backtest its performance. However this may prove difficult as many of the organisations are private. Perhaps listed analogues can be found. USDJPY Japanese PM Sanae Takaichi won a landslide victory in the election over the weekend. The Nikkei 225 was at one point up 3.5% in overnight trading and USDJPY was down as well, indicating that markets liked this result. But we wonder how much of this was a continuation of the rally (short squeeze?) that took place in other markets on Friday. The question now is what does her strong parliamentary support mean for previously declared plans to dramatically increase military spending, as well as her hawkish tone with China? Will the BoJ tolerate higher JGB yields or a much weaker Yen? Or will they somehow manage to get it all - a Yen that trades with reasonable stability between 154 and 160, JGB yields coming down a bit, the equity market holding steady, and inflation at target while the sky-high consumer inflation expectations come down? Seems like a very difficult needle to thread for the BoJ. So no, we think not. One of those things is going to break, and we have a feeling it will be the USDJPY going above 160 in the not too distant future. QQQ ETF Intraday Volatility Higher on Mondays1 - 7 Feb 2026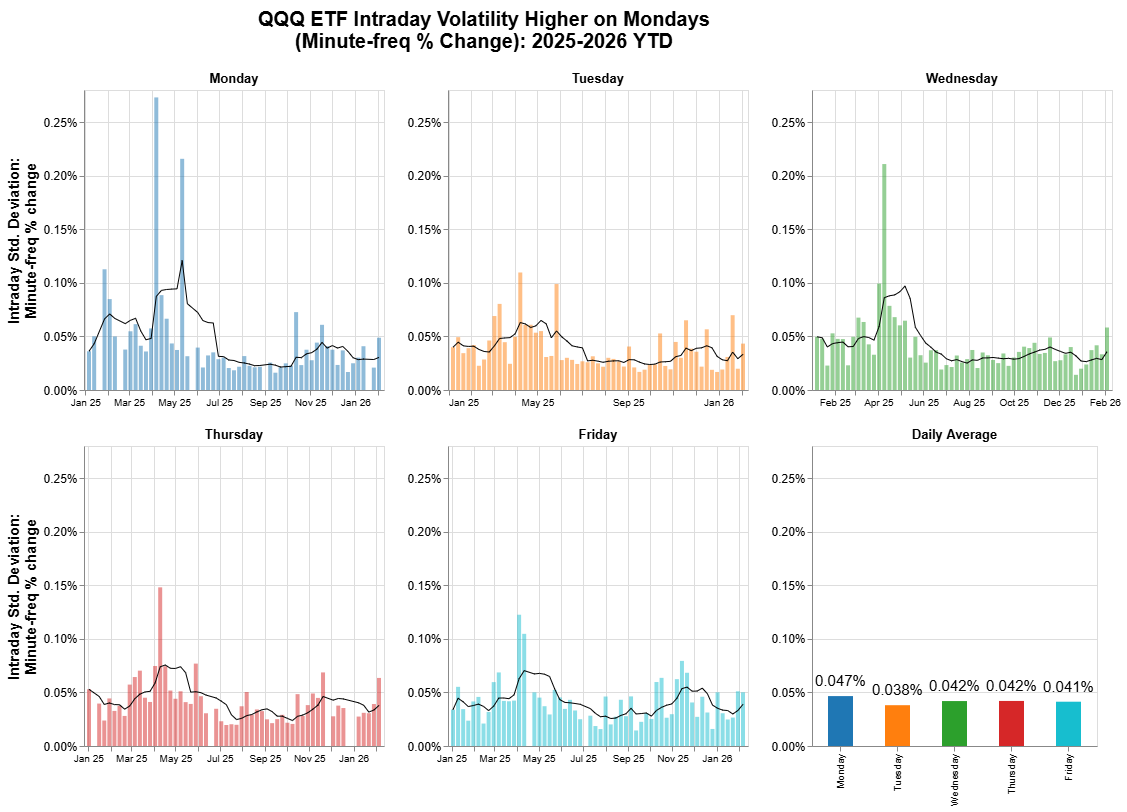
1ETF Intraday Data from Massive Intraday equity volatility seems to vary across the trading week, with Fridays and Tuesdays slightly lower than other days, and Mondays showing the highest volatility, as calculated by taking the standard deviation of minute-frequency percentage price changes for the entire day. This was the result we found looking at price changes for the Invesco QQQ ETF. This supports the anecdote that the VIX (although it is based on the S&P500) tends to drop going into the weekend and spike at the start of a new week. This should not be taken to mean that equities will dip on Monday or that volatility will necessarily increase. We are increasingly of the view that other factors like positioning should also be taken into account when prognosticating about near-term equity market developments. But there is a lot happening over the next few days to which the market may react violently, including the Japanese elections on Sunday and Non-farm Payrolls on the 11th. Leveraged and Crypto ETFs1,2 Dominated Trading Volumes Today - 6 Feb 2026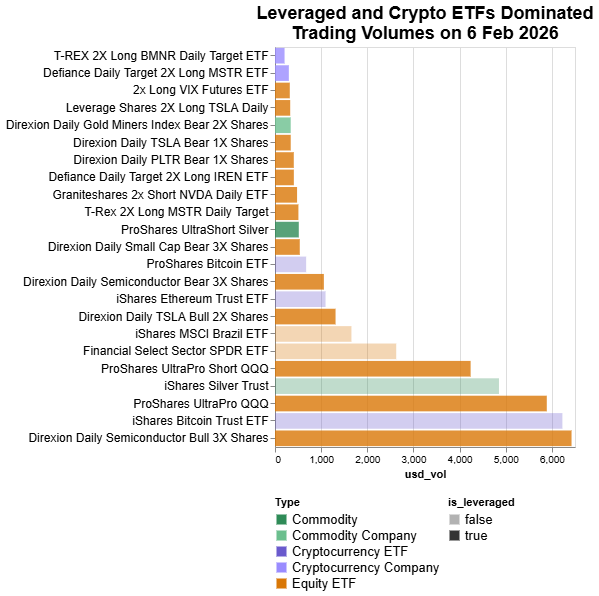
1ETF Volume Data from Yahoo! Finance ETFs 2List excludes QQQ and SPY ETFs On Friday investors piled into semiconductor and cryptocurrency stocks including via ETFs and leveraged funds and products. Intraday volatility in the underlying securities of these instruments are surging and are being magnified to extreme levels through leverage. Perhaps this is more evidence that we are entering a more dramatic volatility regime than we have seen in recent months. Truflation's Real Yields Reach Highest Since April 2025 - 5 Feb 2026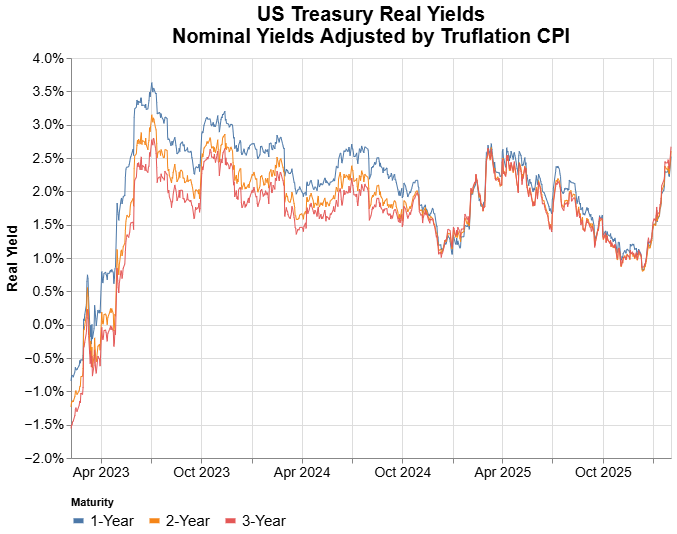
1Truflation data from Truflation Official US CPI data suggests that the US inflation rate is around 2.7% per year. Truflation data suggests otherwise and using US treasuries to calculate real yields for relatively short tenors (1-3 years) shows that real yields have increased to their highest levels since April 2025. In our view, real yields imply two things - monetary or lending conditions are tightening and/or there is an expectation of economic expansion. One of those things tends to be good for asset prices, and the other sometimes happens before market crashes. Is the current environment more similar to the US economy in early 2023, where rising real yields preceded booming economic growth, or to the US economy in early 2025, where a slowdown was occurring, economic uncertainty spiked and financial conditions tightened considerably? We leave this for the reader to decide. Is Crypto Too Big to Fail? - 4 Feb 2026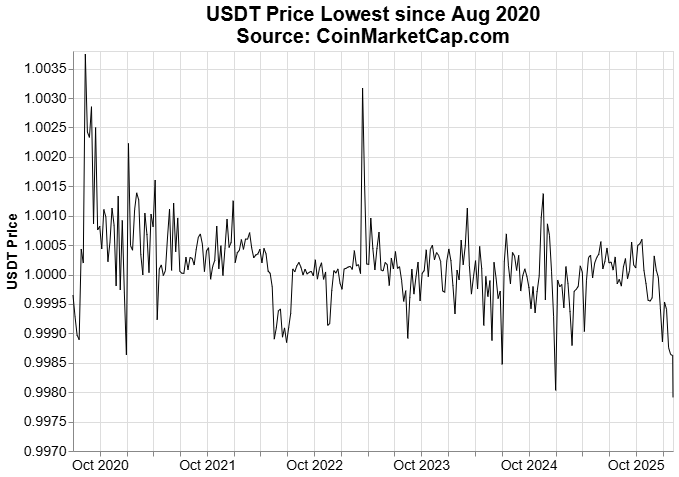
1Tether price data from CoinMarketCap According to BitcoinTreasuries, the top 100 public companies hold 1.13 million bitcoin. At the current price of around $73 000 that is equivalent to around $82.5 billion. With another roughly 2.95 million held by other entities like private companies and governments, they estimate the total bitcoin held this way to currently be worth around $300 billion. At the market top in October when it was worth closer to $123 000 per bitcoin, assuming the same amount of bitcoin was held, this stash would have been worth nearly $500 billion. A loss of $200 billion sounds like a lot but Microsoft alone since its peak in October 2025, having lost 25% of market cap since then, shed $1 trillion - nearly 5 times that. Of course this excludes other cryptocurrencies but bitcoin comprises the majority. There are two reasons why this might underestimate the broader impact. Firstly, many of these companies have raised debt to purchase bitcoin, or may hold other securities as in their overall portfolio. If the price of their bitcoin drops enough, they may be forced to either sell bitcoin or its other assets in a forced deleveraging or reduction in exposure, potentially deepening a selloff in securities markets more broadly. And depending on the capital mix, the overall size of bitcoin holdings, and other factors, the decline of the company’s value (private or public) may be as large as or even larger than the decline in bitcoin. Secondly, as cryptocurrency value more broadly declines, the demand for stablecoins like USDT or USDC may decline as well, and they may face redemptions. These redemptions would likely require selling off the assets held as collateral to maintain the 1:1 peg that these two stablecoins have with the US dollar, potentially also furthering a selloff. Given that stablecoin providers are collectively one of the largest holders of short-term US Treasury debt, and they may choose to sell off these “safest” of assets first (especially if the remainder of their portfolio were in a drawdown/showing an unrealised loss), which would put upward pressure on short-term interest rates (and potentially longer term ones as well). Indeed one can see a hint of this already - USDT is currently showing the largest deviation from its $1 peg since the Covid-19 market turmoil in March 2020, already exceeding the April 2025 drawdown. Granted, the deviation is tiny. But relative to recent history, it is significant. We see two paths forward. The first assumes we are at, or close to, a bottom in large cap equities, indices and other assets like cryptocurrency. Perhaps selling is exhausted and the reversion to previous trajectories and apparent “discount” to peak 2025 levels is too alluring, especially for crypto. We believe this requires a significant positive catalyst. We don’t see this coming from the driver of the previous equity market top (AI and AI infrastructure). Nvidia earnings are too far away - maybe Alphabet turns higher overnight and maybe Amazon blows the roof off tomorrow evening. More likely, we think, is a significantly positive legislative victory for crypto. This would have to come soon, however, as further delay might push the passing of legislation into the next congress. Positive catalysts unrelated to crypto could be a potential ceasefire involving Russia or Iran, a supreme court ruling on tariffs (although its market impact remains unclear), another tariff deal or climbdown. With the SAAS drawdown, private credit BDCs facing pressure, and some major leveraged ETFs like the SOXL down to the October-December 2025 peak, it is likely that large short positions remain accumulated in some names. It is easy to imagine a trigger that could cause significant short-covering and take us up from here. In the absence of a significant positive catalyst, we likely find ourselves on the second road which is far less ebullient and will be characterised by further deleveraging. Not just in the conventional sense of reducing debt exposure, but perhaps even less availability of leverage in the first place. A large provider of Stocks & Shares ISA accounts today informed clients that they would, before the end of February, stop offering trading of leveraged funds and any short ETFs. We were quick to be reminded of the seemingly insatiable betting on commodity price volatility by this headline today - highlighting that the Wisdomtree Oil ETF saw inflows of $200 million today, the largest since the pandemic. After the experience this past week of two restrike events in the same leveraged ETP provider, and the extraordinary volatility which may arise from US actions in Iran (peaceful or otherwise), we are reminded of an adage that the market will go wherever it wants to, but will ensure that you are not onboard. Unless there’s some major good news on the horizon that we’re missing, we are beginning to suspect that leverage itself might be the next victim of this market. Public vs Private Markets - PayPal, Block, Stripe1 - 3 February 2026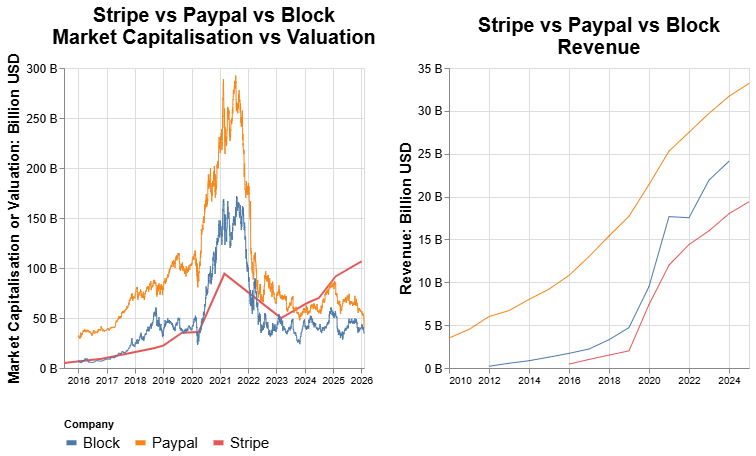
1Stock data from Yahoo! Finance Disclaimer:We own a small PayPal position as of today. PayPal reported earnings today and shed 20% or nearly $10 billion in market capitalisation. Payment processor competition Block and Adyen were down 6% and 7% respectively. Interestingly, this move today puts the market capitalisation of those three companies at $39bln, $36bln and $43.5bln respectively. The three listed companies processed similar total payments volumes in 2024, and PayPal’s release showed they processed $1.8 trillion in payments. Looking at revenues, PayPal exceeds Stripe by about $13 billion or 65%, and Block by roughly $10 billion or 40%. And yet at the moment PayPal and Block have roughly the same market capitalisation. And Stripe’s most recent funding round valued it at $106 billion. Stripe does many things right and many things in addition to being a payments processor. And event this is only a revenue and TPV comparison - it says nothing about profits and free cash flow. Some think comparing these three companies are comparing apples and oranges - two mature, low margin dinosaurs against a private payments innovation machine. But is Stripe really worth over 2.5x as much as PayPal or Block? Could it be that this market-cap-valuation gap will close, and if so, from which direction will it close? On another somewhat sombre note - even though PayPal’s revenue and TPV grew, its share price still dropped enormously amid weaker than expected earnings. Could it be that these online payments processors might be picking up broader economic weakness before it is apparent elsewhere, similar to our earlier views on SAAS? We are increasingly of the view that the total addressable market may either turn out to be smaller for many of these companies (SAAS, payments, entertainment) than investors expected, and that they will ultimately be competing with more market participants than expected for that fixed piece of pie - human attention, not spending power. Sources On commodity volatility - 2 February 2026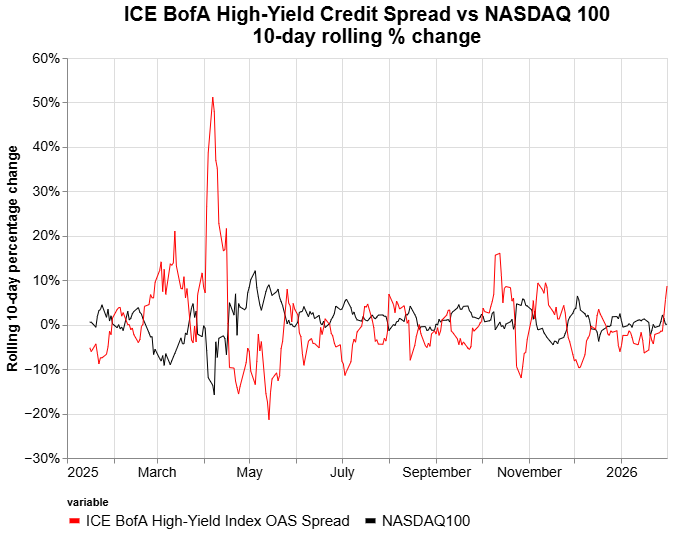
1Source:ICE BofA via St Louis Fred Natural Gas Natural gas had its largest 1-day drop in 30 years, on easing of tensions between the US and Iran, and warmer weather forecast in February. And as we predicted over the weekend, a provider of leveraged natural gas funds experienced a restrike event. When was the last time the same ETP provider had a restrike event on consecutive trading days for different underlying commodities? We’ll be keeping a diary of those. An exploding commodity price volatility regime is only good for market makers and commodity traders, and certainly not for end users or buyers trying to plan for the year ahead. Options prices spike during volatile periods and so those trying to hedge themselves will spend a fortune on premiums. Eggs We recently talked about egg prices in the US likely hitting a bottom, and on that basis looked into Vital Farms and Cal-Maine Foods. Well either there’s a glitch on the website or eggs in the US just dropped 95% to $0.06 per dozen. Most recent USDA data is still pointing at $1.05 and perhaps it has to do with the US government shutdown. Otherwise, something fishy is going on with eggs. Credit Spreads Finally, we saw that the ICE BofA High Yield Option Adjusted Credit Spread spiked again last week. In the past significant spikes have been accompanied with market volatility. The 10-day change is the highest since November when the NASDAQ 100 saw a slight correction. But this spike could have been Friday’s metals panic and might not have broader market implications. The rest of this week might give us a clearer signal but on the whole we’re positioned for some downside here. Geopoliticking - 1 February 2026Disclaimer: We have previously owned, or currently own, positions in silver and natural gas ETPs, long and short. Extreme caution is advised in using these instruments. Natural gas futures opened -15% at 11pm GMT. For those watching, we’re 5% away from a restrike event in some of the leveraged natural gas exchange traded products, like the silver ones experienced on Friday. And indeed silver was down to $77 shortly after market open. It was trading at around $94 on Friday when the silver restrike event happened. And the 20% restrike for the 3x leveraged funds is around $75. If we’re even a little bit out with the margins, it could be that they had another restrike this evening. Over the weekend there was some news coverage about a US “armada” heading to Iran and of good meetings with a Russian delegation. Russia and Iran are the world’s largest natural gas producers behind the US, and major oil producers. We see a near-term catastrophic downside headline risk for natural gas and oil prices on those two fronts over the next couple of weeks - potential peace/ceasefire deals with Russia and Iran. This would likely be very negative for energy prices, positive for equity markets overall, and negative for a handful of recent darling sectors - defense, rare earths, and precious metals. This latter effect would be channeled through a reduction in tensions between the US and China, as Iran supplies a significant amount of China’s oil imports. This could potentially be negative for US and South Korean memory stocks as well, if part of what has been driving them recently has been stockpiling in case of trade disruptions. On the topic of a strike on Iran and whether it would happen, there are a few factors to consider Iran President Trump is already facing pressure because of recent tensions with Greenland and NATO, as well as the ICE killings in the US. Equity market performance has stalled since October and looks vulnerable to the downside. The midterms are fast approaching. Could the US strike Iran, perhaps a highly targeted attack on the Ayatollah, without getting involved in another war? Also the last time the US struck Iran through attacks on its nuclear enrichment facilities, there was not this much advanced warning. The “gigantic armada” seems a lot more like a threat that is designed to be responded to with submission, not aggression. A senior adviser to Iran’s supreme leader, Ali Shamkani, indicated that “...any military action by the United States…will be considered the start of a war…” and that the “heart of Tel Aviv will be targeted”. President Trump specifically noted “no nuclear weapons” in recent social media posts but key US demands remain 1) no nuclear weapons or even enrichment program, 2) reduced number and range of ballistic missiles, and 3) not supporting resistance groups in the area. A deal including reduced sanctions on Iran could see Iranian natural gas and oil exported more widely, which would likely weigh on natural gas prices. This feels like a difficult needle to thread. We are inclined to err on the side of "Trump likes to make a deal". Escalation with Iran, with no recent mention of provocation (unless the alleged deaths of thousands of protestors resurfaces as motivation), doesn't seem desirable. Another caveat to this is that the US is currently the largest natural gas exporter in the world and so, perhaps, it could benefit from a year of elevated natural gas prices. We remain positioned for significant moves in both directions. Russia Kirill Dmitriev, the Kremlin's special envoy and head of Russia’s sovereign wealth fund, met with Steve Witkoff and had “constructive” talks over the weekend. Next stages of the negotiations will likely focus on the 20-point peace plan. Key outstanding issues are what would happen to Ukrainian-controlled territory in Eastern Donetsk and security guarantees against potential future Russian attacks. As Donetsk was one of the first places seized by Russian forces during the 2014 “Russian Spring”, control over this region remains a particular sticking point. Similarly to Iran, a more credible Russian ceasefire would likely lead to significant downside pressure on oil and natural gas prices. Cuba The final bit of geopolitics we’re looking at concerns Cuba. As Venezuela was previously supplying over a third of Havana’s oil, and the US is reportedly considering a naval blockade, pressure is mounting on the Cuban regime. It is worth noting that beyond its undoubted strategic value to the US (much like Greenland) Cuba has the ,world’s 4th largest cobalt reserves and is a top-10 producer of nickel, materials crucial for batteries and other electronics, among other uses. This seems like a geopolitics piece but it’s really more about leverage in the end. We were concerned about a sharp natural gas drop on Friday and took appropriate action to hedge against that. As ever, with a 15% gap move at futures open, we wish we’d taken far more action. This week has served as a crucial reminder of the dangers of excessive leverage, especially within the commodities trading space. It’s quite likely that there may be some rippling effects of the silver drawdown on Friday felt across markets this week. We reiterate our view that this could encourage a move towards private markets, where volatility appears lower. And, conversely, also towards higher-frequency, higher volatility markets. Open interest in the USDC-SILV on Hyperliquid exploded this weekend and could be traded by those too impatient to wait for futures to open Sunday evening. Prognostications - 31 January 2026In celebration of reaching the end of January in one piece, we decided to make a few bold predictions. The tone is perhaps more on the cautious side and so perhaps it appropriate to start with a somewhat more upbeat statement of a view: Abundance may well be within reach in our lifetimes. This has probably never been truer before than it is today. And as a result it is this generation’s fundamental responsibility, to the past, present, and future, to do everything in our power to facilitate that. This view of the future is based on the following assumptions:
In concert, these factors promise to uplift entire swathes of the global population within the next few decades, perhaps most especially on African continent where these factors will contribute to a large, young population joining a more integrated global workforce and participating more actively in its economy. Many significant roadblocks may prevent this deeply optimistic vision of the future from realising. But none of those, we believe, are insurmountable. Now that we have expressed this view we can return to the more Cassandra-like worries that keep us up at night, as it appears we may be on the brink of squandering this historic opportunity. These ideas are expressed simply here and in the coming days and weeks will be expanded upon in more detail.
Silver: A Controlled Demolition - and where to next? - 30 January 2026Disclaimer: We have previously owned, or currently own, positions in silver and natural gas ETPs, long and short. Extreme caution is advised in using these instruments. At one point today the price of gold and silver were down 11% and 35% respectively. They ended the day down around 9% and 27% lower. Given that gold had an estimated “market capitalisation” of around $37 trillion before today's fall, and silver around $5.6 trillion, one could say that today saw nearly $5 trillion in wealth destroyed. This is roughly equivalent to the NASDAQ 100 dropping 10%, and which would be the largest single day drop in market cap ever. It was also fascinating to see it occur while much of the rest of the equity market (excluding resource and mining companies, of course) remained largely undisturbed, and for the VIX to remain relatively subdued. Compare this to the 25% decline in the overall crypto market from its recent peak in October 2025, which in our view had a more pronounced negative effect on the rest of the market (although other factors were involved). Similar to the crypto crash, retail traders were significant participants in the recent silver rally and therefore likely suffered during today’s collapse. Retail represents nearly 20% of the average daily trading volume in US equities. Given the speed at which the precious metal rally happened over the last couple of months, one might argue that the price of silver and gold might not have been reflective of their “true” value in recent weeks. But then - what was the true value? And what does that say about the price of other “assets”, particularly those that are supposed to be a “store of value”? And does it mean that, at certain prices, some assets stop being a store of value? Does the estimation of the value of a certain amount of an asset, like shares of stock or ounces of gold, take into account the price impact of trying to sell that asset? Restrike event - 3x leveraged long silver ETPs Something else happened today that will no doubt come as a very nasty surprise on Monday to some of the less sophisticated traders of leveraged exchange traded products. The 3x leveraged long Silver ETPs run by Wisdomtree experienced a “restrike event”. On the positive side, this saved the product and therefore its holders from suffering a -100% loss of their capital, given that at one point silver was down more than 35% which magnified at 3x leverage would have led to -105% capital destruction. On the negative side, the restrike occurred at a price of $500 at 16:51 to 17:06, after which the underlying dropped another ~10% before closing, which would have led to a further 30% loss of capital calculated from the new restrike price of $500. The surprise may come when, if silver rallies dramatically on Monday, investors who bought the fund on Friday just before closing, find that the capital with which they hoped to be participating in the rally, is far reduced. Apropos of nothing, to add insult to injury, it would be deeply ironic if silver rallied on Monday. Tangentially, in the world of prediction markets, it is not hard to imagine that there may emerge a market for betting on whether certain funds experience restrike events. And this would obviously create problematic incentives for market manipulation whereby rogue traders "hunt" down assets that might be susceptible to large price drops (or spikes). More susceptible markets would likely be commodities (as silver has shown) or those that are more illiquid and could see discontinuous price jumps during thin trading. We have a feeling that we have not seen the last restrike event of the year, and possibly not even the last restrike event for silver leveraged products. And given that leveraged ETPs are a popular product amongst retail traders, they should exercise particular caution with these products. Natural Gas Natural gas has recently spiked significantly, with a 3x leveraged natural gas ETP up over 150% in less than two weeks. If a significant event occurs (large natural gas find or perhaps a deal between the US and Iran, one of the largest natural gas producers in the world, is reached) that increases expectations of future gas production or supply, we could see a significant drop in natural gas prices occurring which triggers another such event. We think natural gas prices are currently pricing in a high probability of conflict with Iran. We suspect leveraged natural gas funds may experience significant volatility this week. If these events increase in frequency, this could have a negative impact on the appeal of and demand for leveraged trading products in general. Where to now? To the mountains and valleys of volatility If precious metals were supposed to be a hedge against inflation or equity market downturns, what are the potential consequences for such a dramatic one-day selloff? We could imagine this having two somewhat contradictory impacts on risk tolerance: for some, this will drive them away from leveraged products and other highly volatile securities, traditionally into bonds but those have been volatile as well. For others, experiencing this sort of volatility in what was supposed to be a “safe haven” asset may raise their risk appetite and tolerance for other far riskier assets. Given that the cryptocurrency market overall is still in a significant drawdown from its October high, not to mention that President Trump’s Federal Reserve pick seems to be a proponent of crypto, we could imagine flows returning to cryptocurrencies and associated funds and products. The chatter on social media that crypto folks were behind some of the silver rally in the first place, fuels this speculation. Another alternative destination for the volatility-stricken may very well be a more illiquid asset class - private markets. And with private assets booming in size, there will be plenty of opportunities. If one does not want to see the regular volatility of daily markets, the appeal of private markets is obvious. However the great Cliff Asness has much to say about the dangers of "volatility laundering". With bond returns being particularly poor in an inflationary environment, and now safe haven assets coming under fire, where do you safely park your money? Soft commodities? Equities? Crypto? Question for the future
The Return of FX1 Volatility - 29 January 2026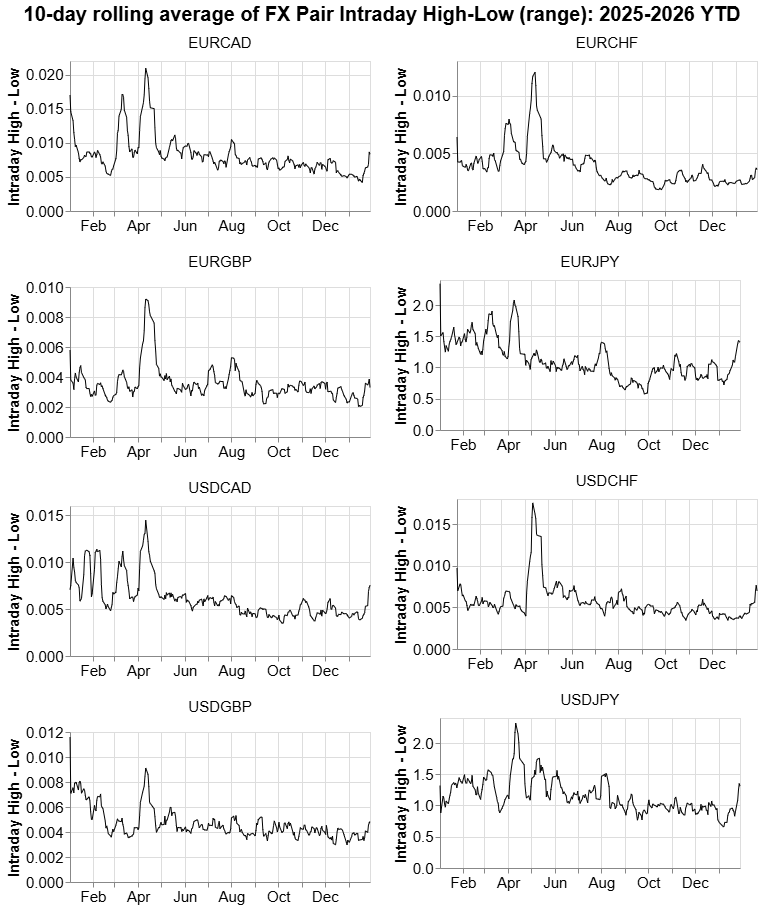
1Stock data from Yahoo! Finance Around 15:00 GMT the DXY US dollar index was around 95.88 when it started to appreciate sharply. By 15:30 it was trading at the high of the day at 96.40, up barely 0.5%. But other assets reacted violently over this same time window, potentially because of this move. Silver fell nearly 11% from 120 to 107 over this same time frame, and gold nearly 7% from 5500 to 5100. There were a few pieces of economic data that came out around then that might have explained it. US factory orders were higher than expected, growing 2.7% instead of a forecast 1.6%, potentially signalling a more robust economy. We’re inclined to say that the cause of the US dollar move was less important than the effect - we believe that move rattled the precious metals trade. And given that gold and silver collectively comprise $44 trillion in "market cap" at the moment, one should not underestimate the extraordinary asset price deflation that a surge in the US dollar could cause. Even if a directional surge is not the base-case here, we are increasingly confident of a pickup in currency volatility more broadly. Several US and EUR currency pairs have started to show some increased volatility over the last few days, with the 10-day rolling average of intraday high-minus-low for some of these pairs hitting the highest since the April tariff turmoil. Rhetoric around foreign currencies has picked up significantly in the last week. This includes President Trump and Treasury Secretary Bessent’s comments about the dollar recently, comments around the South Korean won being too weak and the Chinese yuan being too weak. The semi-annual US currency report was released today as well and while it did not name any specific currency manipulators, the report did state that the US treasury would strengthen its monitoring criteria of other countries. Giving a strong directional view on the US dollar remains difficult at the moment - keeping it low or lowering it further seem to have significant benefits for the Trump administration at the moment. And even today its brief spike higher resolved back down to the 4-year low just below 96. But with the new Federal Reserve Chair in play, increased US currency rhetoric, Japan’s fiscal and monetary policy, and worries about currency debasement coming up, we expect to see this recent surge in currency volatility to continue. And currency volatility has plenty of downstream effects, few of them good. Updates We noted yesterday that one of the most liquid leveraged semiconductor ETFs (SOXL) was approaching a level that it had failed to exceed at previous market tops (around 70). Today at the low it was down -10% to 63. Maybe there was a bit of superstition in the markets. Maybe it's still there. Some Chart Superstition in Tech Stocks1 - 28 Jan 2026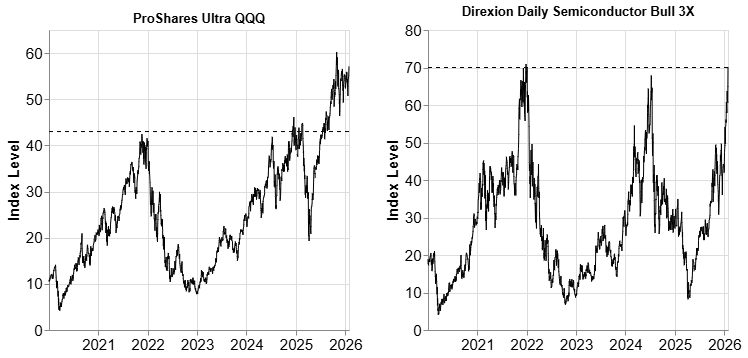
1Stock data from Yahoo! Finance These are two of the most liquid and most highly traded ETFs - the ProShares Ultra QQQ (TQQQ - a 3x leveraged long Nasdaq 100 fund) and the Direction Daily Semiconductor Bull 3X (SOXL). Sophisticated speculators and retail traders alike favour leveraged ETFs because of their liquidity and because they provide opportunity for magnified gain (and losses) and so require less capital to trade for a certain exposure. The gain for TQQQ from 20 to 60 represents a 200% gain over a period of around 6 months. The SOXL gain was closer to 600% over the same period. These are obscene numbers for a 6-month return and we could imagine lucky owners being desperate to cash in on these gains. If you were a US investor looking to realise your gains - would it be worth risking the market turning, in order to be able to wait long enough so that your realised gains would be taxed as capital gain rather than income or would it be better to simply sell off and take the tax hit? Usually we don’t pay much heed to technicals or levels. But with the prevailing conditions, there might just be enough caution in the market for superstition and so it might be worth exercising particular caution when considering semiconductor stocks at these levels. A Commodities1 Supercycle…in this economy? - 27 Jan 2026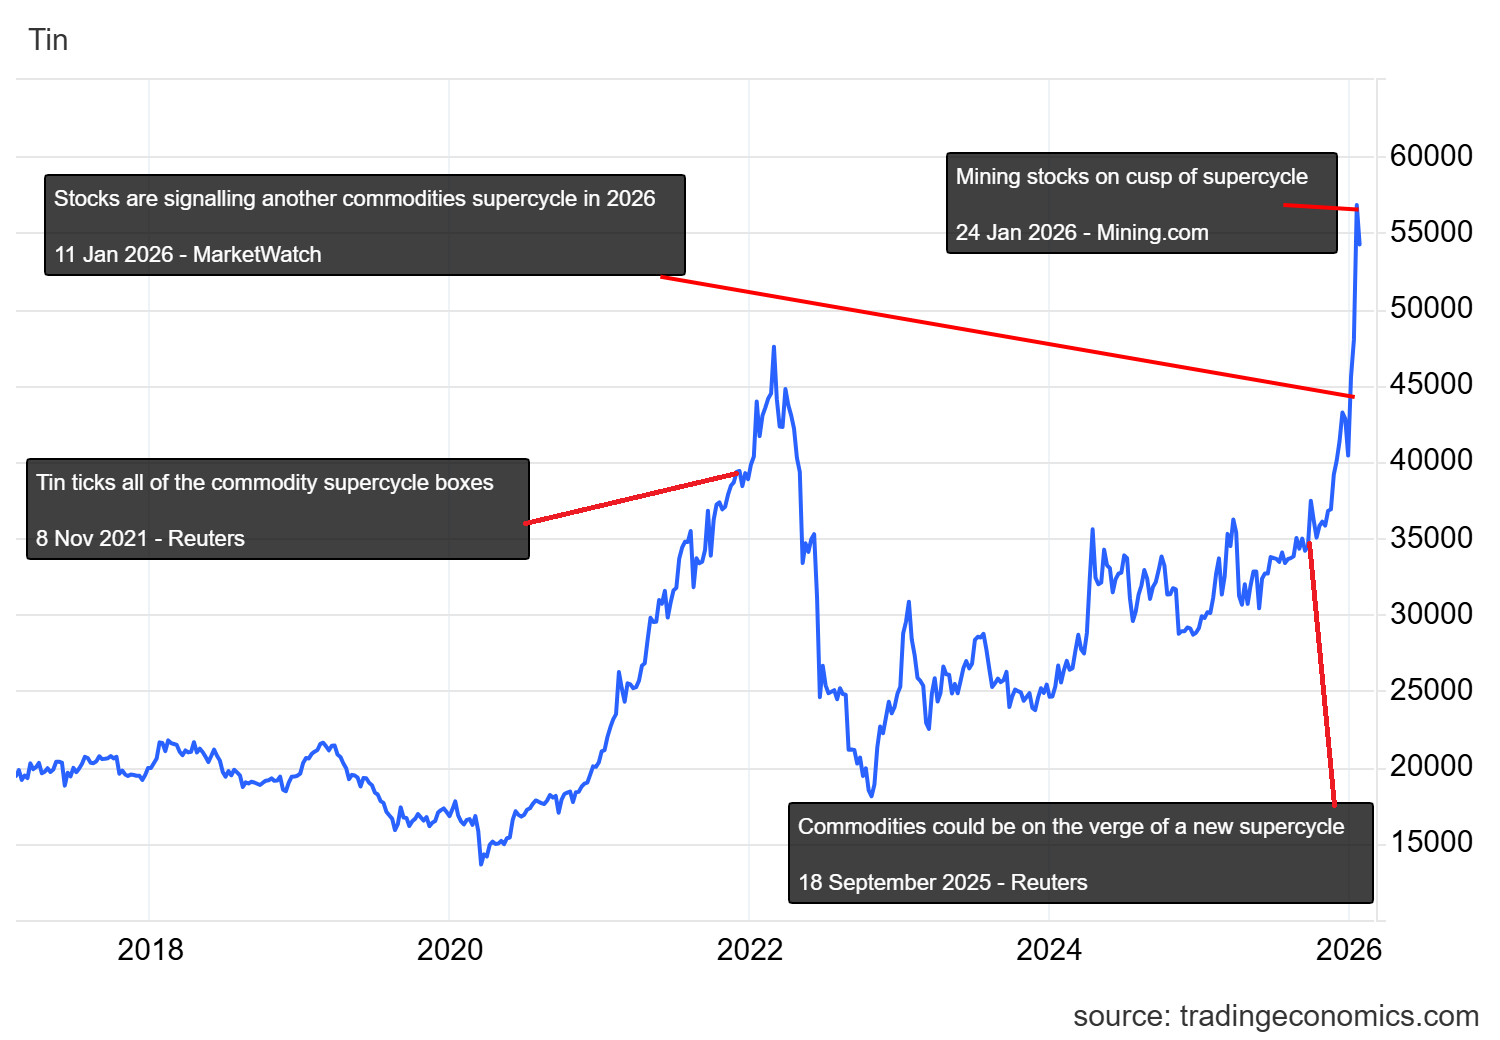
1Tin price data from Trading Economics A handful of cherry-picked articles highlight the difficulty of predicting a commodities supercycle. We do not mean to disparage the brave souls who dared publicly claim a commodities supercycle was at hand, at or near the top of the previous spike in commodities prices. But perhaps there is a certain kind of hubris in declaring that the input costs to much of the world economy is about to soar to new long-term or even permanent highs1234. Niels Bohr is thought to have said “prediction is hard, especially about the future”. Entirely tangentially there’s a great quip about Niels Bohr here from a book by George Gamow. We’ve all been in the position where a confident prediction went spectacularly wrong. We’ve also been in a position where being early on a narrative or trend is the same as being wrong. Or sold too early. But in order to make money in markets you need to be able to at times sit back and see others make a fortune on something you passed on, or dismissed. This sounds like the pontification of someone who was/is out of the silver rally. No comment. So commodity supercycles. This phrase has been floating around on our radar a bit more in the last few weeks. Precious metals’ historic rally has been something to behold. And something to get fired for if you missed out on, or bet against, in a trading position. With the US dollar dropping purposefully below a 4-year low today, a day after we (seemingly prematurely) claimed that rumours of the death of the dollar were premature, the threat of further dollar devaluation and support for the next leg higher in everything denominated in US dollars (i.e. nearly everything), looms large… Federal Reserve Chair Powell slides into view for a rather important meeting of the FOMC, during a storm that has closed federal government offices in Washington DC. Markets expect them to hold rates steady. They’re between a rock and a hard place. At what point does further US dollar decline start to become an imported inflation risk? If they cut interest rates, do they risk spurring inflation? If they hold steady, and inflation has continued to decline in the background, are they effectively pushing up real rates which could hurt bonds and other asset prices. We don’t think the Fed would tolerate much higher yields, or a much weaker dollar. The unexpected move tomorrow would be a cut, or an increase in the treasury buying the Fed has already been engaging in since mid-December 2025. This would put further pressure on the US dollar and probably provide enough impetus to see the Nasdaq back through to all-time highs and beyond. Because it means real interest rates are coming down. It also, incidentally, would play into Steve Donze of Pictet Asset Management Japan’s rhyming US dollar chart which is keeping us up at night, and making us wonder whether there are still a few rungs lower to go for the USD. That might just be enough to keep this “commodities supercycle” that we’ve been hearing about going, or off the ground. The only other thing to do so, in our view, would be that state actors have been acquiring essential raw materials because they are preparing for war or other catastrophic supply chain disruption. And if that is the case, then this commodities supercycle is indeed just getting started. Short of that, however, we think we are at or close to the turning point in the USD and therefore in everything priced in USD. Expensive commodities are very bad for inflation and for politicians unless there’s a war or a pandemic to blame it on. The Death of the Dollar12 (has been greatly exaggerated) - 26 Jan 20261Stock data from Yahoo! Finance 2Federal Receipts Data from St Louis Fred Every now and then a chart does the rounds on social media highlighting the decline of US dollars as a percentage of foreign exchange reserves. There is something compellingly monotonic about the decline in that chart, granted. The US dollar index is down nearly 10% from the start of 2025. The yen recently strengthened dramatically against the USD. Precious metals have exploded upwards in price in the last year. President Trump’s recent rhetoric on tariffs and Greenland and threats of another US government shutdown have all weighed on the dollar. But in addition to the contrarian notion that when social media starts to say “the dollar is dead” (or some such) it usually means the opposite, the world (and specifically all US taxpayers in it) is about to be reminded that there is something very important one can only do with the US dollar - and that is pay US taxes. Tax day, April 15, is fast approaching. And given that 2025 was another stellar year for US equities (even though it underperformed other markets), following two other stellar years, we expect the amount of tax receipts flowing into the Treasury General Account (TGA) to be extraordinary. The barchart below shows how dramatically Total Federal Receipts spike in April in particular, but also in some other months (typically quarter-end like June, September, December). 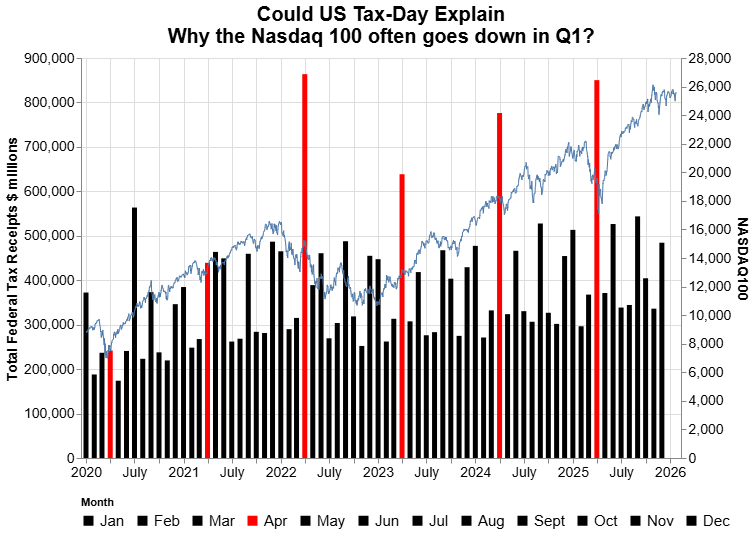
Perhaps the most interesting observation is how often the months leading up to a significant April-spike in TFR seem to exhibit a declining equity market (as shown here by the Nasdaq 100). This pattern is observed in 2020, 2021, 2022, modestly in 2023, 2024 and dramatically in 2025. One explanation for this might be that as taxes are paid and money flows into the TGA, it exits the banking system and thus reduces banking reserves and effectively drains liquidity out of the monetary system. This is particularly pronounced in the tax season following a year of significant equity gains. It is interesting to note that in 2020 the tax deadline was postponed to July 15 due to the Covid outbreak, announced on March 21. This happened again in 2021 and was announced on March 17 that year. As a result the April-spikes are not so pronounced. This same pattern can be summarised somewhat differently as below, for a longer horizon. The chart compares annual Nasdaq 100 performance with the % change in annual tax receipts. The relationship is particularly pronounced during years where the equity market has declined significantly (e.g. 2000-2002, 2008, 2022). 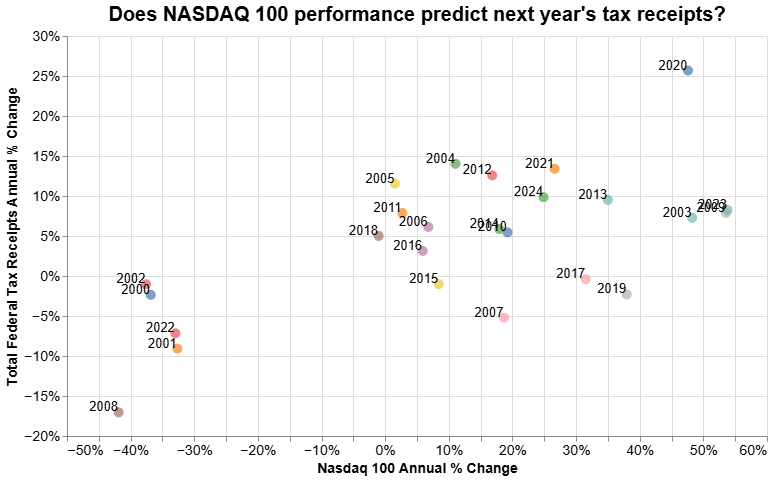
We are not the only ones evaluating this. The Federal Reserve was sufficiently concerned about a liquidity drain running up to this date that it restarted buying US treasuries. We are also curious whether the strong performance of equity markets in 2025, combined with the dramatic rise in certain assets already in 2026 (e.g. precious metals), will exacerbate this phenomenon. Given that some of the realised gains from 2025 might have been redeployed already (which means they would need to be sold again, if some of the proceeds had already been earmarked for tax payments), we also wonder whether this could lead to some downward pressure on equity markets going into April. What lies ahead? Here we’ll float some ideas, in increasing order of drama, in which either the liquidity drain could be averted/postponed and/or the potential financial market impact reduced:
We believe that President Trump does not want the current equity market rally to end and that this period is known for financial market instability. So it seems likely that one of these or another tool may be used to keep the liquidity flowing. But until we see something like that happening - what do we say to the death of the dollar? Not today. And if the US dollar starts to rally dramatically from here, it goes without saying that everything priced in US dollars is going to be in for some turbulence. We’re looking at you, silver, and at you, USDJPY. Software as a service1 (as an economic indicator) - 25 Jan 2026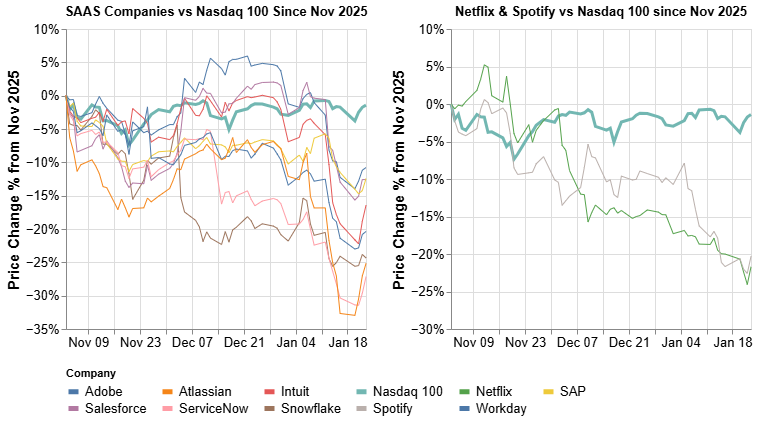
1Stock data from Yahoo! Finance Software-as-a-service companies have experienced a bloodbath in share prices over the last year. One of the main reasons given for this is that many people seem increasingly of the opinion that software has become a commodity that can be much more easily produced with LLMs. They are quick to declare “SAAS is dead”. There are critics of this view, and we resonate with some of them. Just because some of these tools are easier to build (or rather, prototype) does not mean they are easy or cheaper to maintain and internally developing anything means that the cost is brought forward, whereas with SAAS it’s spread over time. An alternative explanation for the decline of SAAS is as follows: many software companies are often initially valued at very high revenue multiples for a long time because of the expectation of significant continued market share growth and earnings in the distant future, because of “winner takes all” dynamics in this business. However as more competitors join the market, market share growth plateaus, and the expectations of significant future growth for each individual company diminishes. So instead of being valued like a company that will have a 60% market share in the future, it may be closer to e.g. 20% or 30%. If this is why SAAS companies have tumbled - that the total addressable market was either smaller than expected, or each of these companies’ relative control of this market was overestimated, then it seems unlikely that SAAS companies will recover quickly (or ever) to their recent highs. Caution warranted. A third potential reason for why SAAS companies are down is that subscription-as-a-service is struggling. This could be because of subscription fatigue and/or cost-cutting drives. We think of SAAS expenditure as a barometer for overall recurring corporate expenditure. And if this is being tightened, this may not bode well for the business cycle and perhaps for equities more broadly. This could also explain weakness on the consumer side, with video-streaming companies like Netflix and music-streaming companies like Spotify performing poorly since the end of Q2 2025 and particularly since November. It might be useful to consider online payments processors like Paypal, Block and Adyen in this equation as well and so Paypal's earnings call on the 3rd of February will be closely watched. In conclusion we think SAAS might be down (beyond broader market movements) for one of three reasons:
In our view only if reason 1 explains the weakness then we believe SAAS companies could be worth more investigation. If either of the other two explain it, more caution is warranted. Another week of tariff escalation? and Intel (again) - 24 Jan 2026US President Trump has potentially set the stage for some more tariff conflict this week, tweeting that Canada would face 100% tariffs if it signed a trade deal with China. This is a rather sharp u-turn from what seemed like approval of such a deal a week ago but is perhaps in response to Prime Minister Mark Carney’s speech at Davos. The deal in question would see Canada import around 50 000 electric vehicles from China at a tariff of 6.1% instead of 100% and Trump is worried about Canada (and Mexico) being effectively used as “transshipment” hubs to skirt US tariffs on China. Canada’s EV sales have plunged in recent years. One outcome of this escalation could be a deal between the US and Canada on EVs and we imagine this could be positive for US electric vehicles manufacturers like Tesla or Rivian (in which we hold a position). In the very near term, markets could react negatively again. Especially with the threat of shutdown looming large again after another US citizen was fatally shot in Minnesota. It is interesting to see this trade escalation, impacting Canada but clearly directed at China, happening in parallel with what appears to be a somewhat softer tone in the recent National Defense Strategy document, posted on Friday. The document emphasises that the US would “deter China through strength, not confrontation”. This “walk softly and carry a big gun” approach is less aggressive than in the past which is noteworthy given reports that President Xi Jinping is further consolidating his power over the People’s Liberation Army. And on South Korea it noted, under the heading of “Line of Effort 3: Increase Burden-Sharing with U.S. Allies and Partners, that it was “capable of taking primary responsibility for deterring North Korea” and that US support would be “more limited”. It is at this point worth noting again that North Korea may be sitting on the world’s largest reserve of rare earths. The importance, and surging prices, of these materials could cause a re-escalation of tensions between North Korea and South Korea and could rouse the interest of both China and the US. This somewhat conflicting messaging - explicitly anti-China on social media, but significantly more reserved in official documentation or positions like the NDS - begs the question - where should we look for the truth of President Trump’s attitude towards allies and competitors alike? We are beginning to think sometimes the tweets and other social media appearances might be part of an overall negotiating tactic, and that the truth can be gleaned from his statements at large live events, or wider forums, as with his recent Davos appearance. We were firmly of the view that Trump would not use military force with Greenland and were vindicated in this view. And we think Trump will similarly reach a deal with Canada. Intel We highlighted 3 potential reasons why the US government might want stakes in certain companies like Intel. The 17% decline suggests that reason 3 might have more to do with the logic than we initially thought - the cited WSJ article byline reads "...troubled chipmaker reminded investors why it needed a bailout in the first place” (our emphasis). Brutal. The article goes on to mention that Intel had spent months cutting capacity on older production lines and therefore were unprepared for a surge in orders for older processors. This seems like a spectacular own-goal, with the only real defence being something along the lines of “this is going to be a long process - be patient”. Between that and potentially laying off 25 000 of its employees, it has some similarities with Stephen Elop’s tenure at Nokia. If Intel’s Arc GPU doesn’t perform well, it would seem that the major beneficiaries of Intel’s policy at the moment are its competitors AMD and Nvidia. Indeed at the moment the real winners are investors who bought Intel stock near the ~$18 lows in April 2025 (the US government being one of them). The other direct winner is of course Nvidia which announced a ~4% stake in Intel in a deal that was completed in December 2025. This stake which cost $5 billion at the time was made at around $23.28 per share. By the end of Q4 Intel was priced at $37 per share or a gain of nearly 70% around $3.5 billion. If Nvidia treats it as a fair value investment for accounting purposes (instead of equity, which is more common for larger stakes and associated with strategic control), it could show up as an unrealised gain and boost Q4 earnings by ~$3.5 billion. This would be reminiscent of Amazon’s Q4 2021 earnings being boosted dramatically by its stake in Rivian at the time. Unfortunately that did not turn out so well for Amazon in the end. We hope, for everyone’s sake, history does not rhyme for Intel. We bought some again at around -15% down on the day after their earnings were announced. After plunge US Egg Prices are up 120% in a week - 23 Jan 2026
Data from: Trading Economics Farmers have been struggling in recent years. In the US, farmers are facing $44 billion in net cash income losses across corn, soybean and wheat for their 2025-26 crop due to rising input costs, lower crop prices and trade war impacts. There are similar stories in Europe. And in the UK, a report found that farming was no longer profitable for the average farm. This could pose risks to the future supply of food. Food is one of the many things we’ve become accustomed to importing and therefore for which we have enjoyed lower prices. In a less collaborative world, it may become more important to be able to produce food domestically. The US relies on imports for roughly 20% of its food, and the UK about 40%. Covid-related supply chain disruptions showed us what can happen to the price of various foods during extreme events. When prices in a market fall significantly, the less efficient producers either go out of business, get acquired, or get subsidized. In many such cases market concentration will rise which increases suppliers’ pricing power, which can lead to price increases later. And given that agricultural commodities’ supply are significantly affected by the weather, which is effectively random (or very hard to predict) at long time horizons, their prices can move in cycles punctuated with shocks. A good example of such a product is eggs in the US. The price of eggs, as shown above, spiked dramatically during Covid and again even more so during the HPAI outbreak in 2024 and 2025, reaching $8 per dozen. Since then, the price collapsed to $0.33 per dozen, down nearly 96% from the peak. When adjusting for inflation, as far as we can tell this is the cheapest eggs have been since 1990 possibly ever. This is likely due to a reduction in the avian flu cases, some amount of demand destruction at such high prices, and a reduction in overall calorie consumption as well as that of many baked goods like cakes (due to Ozempic). This excellent article by the St Louis Fed discusses the market for eggs. Some of the listed egg producers in the US (Cal Maine Foods and Vital Farms) have seen substantial declines in their share prices since August 2025, by which time the collapse in egg prices was well underway. Perhaps this suggests that their earnings are not so sensitive to declines in prices or perhaps there hasn’t been enough time for that effect to pass through. Egg prices have now fallen to a level such that many consumers will a) be able to afford them and b) may be less sensitive to even large percentage increases in their price. This presents a potentially asymmetric opportunity for egg producers and their equity stocks. Egg prices are clearly very volatile. But 120% in a week is a staggering rise. Whether we saw the bottom in prices is uncertain but at this rate it is one of the cheapest sources of protein - $0.33 for ~ 80 grams of protein or $0.004 per gram is incredible. And this will likely not last. We have taken a position in Cal-Maine Foods and are evaluating Vital Farms as well. There is one important caveat. In a lawsuit filed originally in 2011, Cal-Maine, along with other producers, were found guilty of conspiring to limit egg supply to raise prices between 2004-2008. Beyond the moral outrage at fixing the price of a staple protein, we are also concerned about a repeat of this outcome with potentially far more significant damages. Several class action lawsuits accuse egg producers and a particular media company (formerly Urner Barry Publications, now part of Expana) of participating in price fixing behaviour. Under the Trump administration there has been an increase in antitrust investigation into agricultural producers, including egg producers. We might just be counting our eggs before the producers have chickened out. Question for the future
The new widomaker trade? - 22 Jan 2026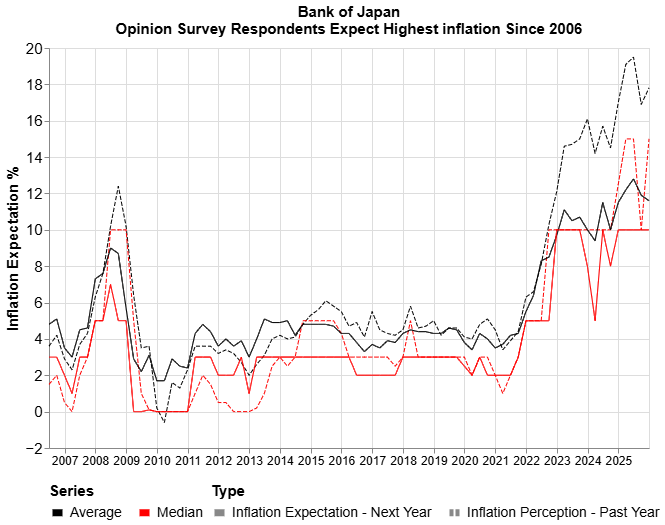
Opinion Survey Data from: Bank of Japan The Bank of Japan (BoJ) is announcing its interest rate decision soon. Markets seem to expect them to hold rates steady at 0.75%. With a chart looking like the above, for the BoJ to do that either means we misunderstand something, or they are ignoring their current survey respondents. These respondents said they expect inflation to average 10% per year for the next 5-years. Expectations are the highest since they began collecting this survey data, and the last time it was this high was just before the Global Financial Crisis. And they do not seem to be budging lower. With Japanese Government Bond (JGB) yields at skyhigh levels, the BoJ can’t really afford more inflation but they also might not be able to afford an interest rate hike and the ensuing impact. They are between a rock and a hard place and if they hold rates as the market seems to hope and consumer inflation expectations do not start to come down rapidly they might be in trouble. Will they really tolerate such high consumer inflation expectations? Is it just a matter of time before those expectations translate into wage negotiations? In the past, the widowmaker trade was to be short JGBs. In the last couple of years, that has been flipped - and shorting JGBs has been one of the best trades available. Perhaps now we’re about to move into a regime with such volatility in these instruments that participating in the market at all could be the new widowmaker trade, especially on the very long maturities like 30-year or 40-year bonds. Bloomberg noted that a mere $280 million of trading volume in the long-dated bonds caused much of Japan’s bond market ructions this week. On an unrelated note. Intel’s disappointing performance after earnings is somewhat worrying. Does this mean anything for the portfolio of companies that the US government has invested in? We were at least vindicated in our begrudging decision to sell the remainder of our Intel portfolio. Or is this a buying opportunity and possibly the last time you could get Intel at that price? TACOs at Davos, and Intel - 21 Jan 2026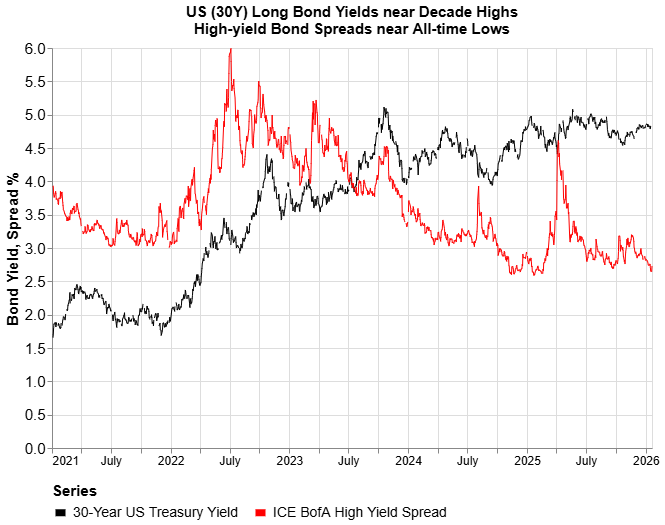
Bond yield and credit spread data from: St Louis FRED President Trump delivered a one-two market-boosting combo from Davos today - first indicating that he would not use force to take Greenland (as we suspected), and second taking tariffs off the table because of the prospect of a “Greenland deal” that arose from negotiations with NATO’s Mark Rutte. We’re somewhat surprised by the extent of the apparent climbdown and markets were clearly bursting for this good news - with the NASDAQ 100 ripping from the day’s low of 249 to a high close to 255, an intraday range of nearly 2.5%. We won’t go so far as to point out the things that can be purchased with such a gain in US equity market cap… We are hesitant to trust the rally today. It smells a bit like a short squeeze. It seems unlikely that uncertainty around Greenland and associated tariffs is over and if not, there’s more market volatility to come. If it is over, we worry about the credibility of President Trump’s threats, more specifically the loss thereof, if he is seen to have climbed down so quickly. If he can no longer inspire fear and awe with threats around tariffs, we are concerned about the tools he may resort to in order to achieve his goals. Arguably, this time around he already resorted to threats beyond tariffs in the shape of potential military force. Equity markets are an important metric for Trump. And we’ve seen in the past how he was willing to tolerate a certain amount of pain in equity markets, which added to the credibility of his threats. So the worry is that their current lofty levels mean there’s a lot of ammunition left for him - he can make wild statements and threats and afford to sit back amid the ensuing market chaos (and, effectively, implicitly, take credit for whatever market swings apparently result from his threats). One caveat we have here is that it might not be equity markets that prove to be the limiting factor. The 30-year US Treasury Yield is sitting at around 4.8%. This is close to the pain threshold of 5% that we’ve seen the yield retreat from a few times this year, coinciding in April with dramatic tariff climbdowns or deals. And with the additional threat (although ludicrous and self-immolating, in our view) of European funds dumping US government bonds looming above him, perhaps Trump pulled back so quickly because we were already close to the pain threshold in long term yields. If this was the thinking, then this equity rally probably has some more legs. Another risk factor worth looking at again are credit spreads which we covered shortly before the tariff meltdown in April 2025. Junk spreads are very close to the Jan 2025 lows (2.65 yesterday vs 2.59). And therefore, close to all-time lows. Does the market really believe, at the moment, that junk-rated companies are at the lowest risk relative to investment grade companies, ever? This seems a bit optimistic, especially with the redemptions that have been happening in private credit. As a result we’re liable to interpret this number as something of a floor - it is unlikely to go much lower, and when it does go up, it tends to be paired with market turmoil. Indeed today it did spike 8 basis points, an increase of around 3% or in the 93rd percentile of daily changes. Not great, not terrible. But if your dosimeter only reads 3.6 roentgen, then maybe you should check your dosimeter. IntelOn a somewhat unrelated note, Intel is reporting earnings tomorrow evening. We exited the remainder of our Intel position today and are already sad about what seems to be the inevitable rip higher. What if it’s another Oracle-type earnings call and this multi-hundred billion dollar company simply goes up 40% after hours? This earnings call could be a bellwether for a few things - US semiconductor manufacturing, as well as, perhaps more importantly, what happens to companies in which the US government takes a stake. If Intel earnings disappoint, could it mean something bad for the other companies the government has taken stakes in? The US has made investments in several listed and even private companies including recently a private alumina (and gallium) producer. And we’ve been trying to determine what variant of late-stage capitalism or statism this really is: does the government want stakes in these companies because
Reason 1 and 2 are likely positive for future share price prospects. However 3 could mean the government were effectively planning to subsidize an otherwise inefficient on uncompetitive company, which we think bodes less well for share price growth. A lot is riding on this particular company’s earnings tomorrow. There was an eerie moment today at Davos - President Trump said that the Dow Jones would reach 50 000 soon and double after that. James K. Glassman gave a rather critical address in early 1999 on the topic of government ownership of stocks. He also co-authored a book with Kevin Hassett, now director of the National Economic Council and potential future Federal Reserve governor, called Dow 36 000 calling for the Dow Jones, then at 9000, to double and then double again. It's a good thing we're not superstitious here. If we had to make a call, we’d say a bit of uncertainty is back. The Nasdaq 100 didn’t even get close to the October lows. The VIX could still have further to fall and if so quite soon options are going to be very cheap again. Overall we’d warrant caution in both directions. There are potential headlines which could appear over the next few weeks, including the supreme court tariff result, which could spike equity market volatility again. Today was a reminder that face-ripping rallies can come out of nowhere. When do Japanese Government Bonds1 Become Attractive Again? - 20 Jan 2026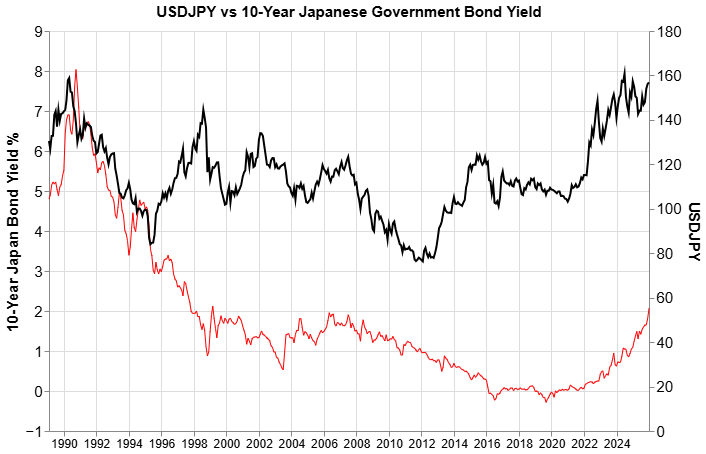
1Bond yield and USDJPY data from: St Louis FRED Japanese Government Bonds (JGBs) would likely have been the main financial news story today, had the spotlight not been stolen by the rest of the world’s response to President Trump’s rhetoric about Greenland and his impending arrival at Davos tomorrow. The yield on 40-year JGBs hit 4% for the first time. You can now lock in a 4% return for 40 years. Admittedly, it’s in Japanese Yen which has been bumping up against the 160 USDJPY ceiling, and it seems like the whole world is holding its breath to see whether it breaks through that ceiling with purpose, and whether the Bank of Japan steps in to calm markets. US Treasury Secretary Bessent pointed out that the two-day yield spike in JGBs was a “6-sigma” event, the largest move in yields since tariff “Liberation Day”. USDJPY trading at 160 feels like a psychological barrier. It most recently reached near that level in early 2025 before the tariff market meltdown and in Aug 2024 before the yen carry-trade unwound. As a refresher on the latter - with interest rates so low for so long in Japan, investors had borrowed Yen to buy equities abroad, increasing the supply of Yen, the demand for currencies (mainly the dollar) and for US equities. Some weak US economic data and the largest rate hike since 2007 later, and the Nikkei had its worst day since 1987 and the Yen strengthened 11% against the USD within a month. Part of the reason for the panic was the expectation that the yen would appreciate suddenly and so borrowed yen came flooding back to Japan under duress. On the one hand, we’d like to think that the 160 ceiling is likely to hold (even if it gets pierced temporarily). And if so, the prospect of a 4% yield in a (potentially) appreciating currency seems irresistible. However this might be too good to be true. There are a few reasons why caution may be warranted. Results of the 104th Opinion Survey of the General Public’s Views, published this Monday 19 January 2026, show that the median household 1-year inflation expectation is 10% and a mean expectation of 12.8%. And survey respondents said they feel like prices are up 20% over the past year. A paper by the BoJ shows how inflation expectations, having been seemingly securely anchored around 2% for most of the last 15 years, have become completely unanchored and even at the time of publication (April 2025, with data seemingly up to 2024) was already exceeding levels reached before the Global Financial Crisis in 2007. The BoJ is still reducing its bond buying program by ~$3 billion per quarter. It has also started a mostly symbolic sale of its equity ETFs and REITs - it plans to sell ~$4 billion in market value per year and in September 2025 its portfolio was worth over $500 billion, so this will take more than a century to complete. It is currently sitting on nearly $300 billion worth of unrealized gains on its ETF holdings. This is however in rather stark contrast to the $200 billion in unrealized losses on its JGB portfolio as rates have continued to climb. If the BoJ hopes to realize the stock market gains and transfer these profits to the government coffers, it may need to do so at a slightly faster pace than $4 billion per year. Finally, Japan’s Prime Minister Takaichi has called a snap election for the 8th of February in the hopes that she can translate her personal approval ratings into a larger more tenable majority for her Liberal Democratic Party and the Japan Innovation Party with whom the LDP have a coalition. An unprecedented amount of defense spending, market-friendly policies, a spat with China about Taiwan, and an election the result of which is by no means a foregone conclusion - could this be the main macroeconomic act moonlighting as second fiddle? Again, the temptation to buy JGBs at these rates and with USDJPY at this level is high. And if you're generally of the view that longer term yields and inflation are trending down, this might be the last time you get a deal like this. Someone has clearly been selling them - but maybe this time the widowmaker trade is actually being long JGBs. The Old Man and the Sea(s) - 19 Jan 2026
Attribution: Gorak tek-en China-Taiwan relations have featured prominently in the media in recent months. 2027 is seen as a critical year by some foreign policy experts because it is the centennial anniversary of the founding of the People’s Liberation Army, the 21st convening of the party congress and the year by which China’s army needs to have completed material preparation to be able to conduct major combat operations. Some recent analysis characterises thoughts around this in a dashboard or a scorecard. This leads us to ask - what are some examples of disruptive policy that China could implement which would provide it with sufficient plausible deniability thereby not provoking a justified (or legal) military response or drawing sufficient international attention or response? The New York Times reported recently on thousands of civilian fishing boats being mobilised into 200-mile long walls in the South China Sea. They quote Gregory Poling of Centre for Strategic and International Studies saying that this could be used in support of a “quarantine”, a measure that would fall short of an act of war, but could cause disruption to Taiwanese trade. A quarantine is also more likely in the short term than a blockade or invasion. It is worth noting that Taiwan’s GDP is extraordinarily exposed to trade and therefore to any disruption of its shipping routes. It is also nearly entirely reliant on imports for its energy. This recalls the accidental (probably) disruption caused by the 2021 blockage of the Suez canal by the Evergreen and ensuing market reaction. The South and East China Seas, the Yellow Sea and the Sea of Japan have trade corridors that are narrow at certain points and could feasibly be disrupted by coordinated, ostensibly civilian, fishing vessels. In essence, these routes seem like potentially vulnerable logistics targets which could be disrupted with relative ease and cause significant uncertainty and financial market volatility for Taiwan and the US and Europe. The Return of Uncertainty? - 18 Jan 2026President Trump’s tweets recently around a potential acquisition of Greenland over the weekend has stoked the ire of EU members and NATO have issued a joint statement on this. There have been talks of readying a “trade weapon” by the EU, as well as up to EUR 93 billion of potential tariffs. Weekend futures markets are showing the Nasdaq down -0.9% and Dow Jones down -0.7%. Interestingly, major German and French indices are indicating down -1.3% and -1.1%. This could very well just be posturing and classic negotiation tactics - start with a flurry of worst-case scenario threats in the run-up to negotiations in Davos, which gets a harsh initial response from the EU, and then resolve to strike a deal somewhere quite reasonable in the middle. It might even be another case of the controversially termed TACO. From a financial markets perspective, we don’t believe they are pricing in a significant ramping up in tensions between the US and EU (yet?) and certainly not a military intervention or standoff in Greenland. If, as we are led to believe, a key complaint of the US in this recent rhetoric is the EU and NATO’s lacklustre military spending and insufficient military presence in Greenland in particular, then ironically the latter may already have been partially addressed with NATO troops sent to Greenland. There is a caveat to this. Equity markets are at or near all-time highs, opening up some questions about stretched valuations. There have been some significant private credit fund redemptions. Bond yields have remained relatively elevated while inflation rates and expectations have softened somewhat. Truflation’s measure of inflation has been coming down quite quickly. This means real yields have been spiking. For two Fridays in a row, CBOE Put-Call Ratios have dipped outside of typical territory. The Federal Reserve has been adding liquidity for “technical reasons” for over a month now, and seemed concerned about the April 15 tax deadline and ensuing liquidity. The Supreme Court may rule as early as this week on the legality of President Trump’s tariffs, the impact of which on the economy, financial markets, and on his policy response, is unclear. There is also some contention in crypto land, with Coinbase CEO Brian Armstrong apparently managing to kill a senate committee vote with his opposition to the CLARITY bill. Financial markets are very good at pricing risk - specific, measurable quantities and relatively well defined outcomes with tractable probabilities. They are less good at pricing uncertainty. During the March 2020 Covid market meltdown and the April 2025 Tariff crash, US economic policy uncertainty spiked dramatically. And there is some potential here for a political misstep to start a chain reaction of policy responses that reignite this uncertainty. In the face of this uncertainty, one can only look to the incentives at play here. If President Trump is truly getting on war-footing, and suspects escalation from, or wishes to escalate with, Russia or China, further attempts at acquisition and ensuing rhetoric are highly likely. Furthermore, tariffs with a deadline could be an effective measure to frontload imports or stockpile important goods, and also consumer spending (boosting Q1 GDP), especially the latter if the threat of tariffs reignited inflation concerns. A somewhat fringe notion is also interesting to consider. With all this uncertainty going on, and the US government likely having additional information on other potential sources of disruption that may emerge over the coming months, President Trump may well suspect that financial markets will turn down in this quarter, independent of his policy actions. If markets are already “due” to turn down, for whatever reason, there is some logic in “leaning into” it. Perhaps it is better to be seen to be responsible for a market crash, and possibly also for its end when it finishes, than to be blamed for being able to avert it. It is admittedly a bit far-fetched and 4-D chess. But it would certainly not be the strangest thing to have happened in the last year. Having observed how this market has been virtually unwilling to go down in any meaningful way since April 2025, it is very tempting to call this resurgence in tension posturing and an opportunity to buy the dip. And it's at moments like these where all the sagelike platitudes of "it's about time in the market, not timing the market" and "more money is lost waiting for a crash than in the crash itself" tend to resurface. But on the other hand, people probably weren't expecting April 2025 when they were standing at all-time highs in February 2025. So just ask yourself - do you feel lucky, punk? CBOE Total Put Call Ratio1 vs Equity Indexes2 - Extended - 17 January 2026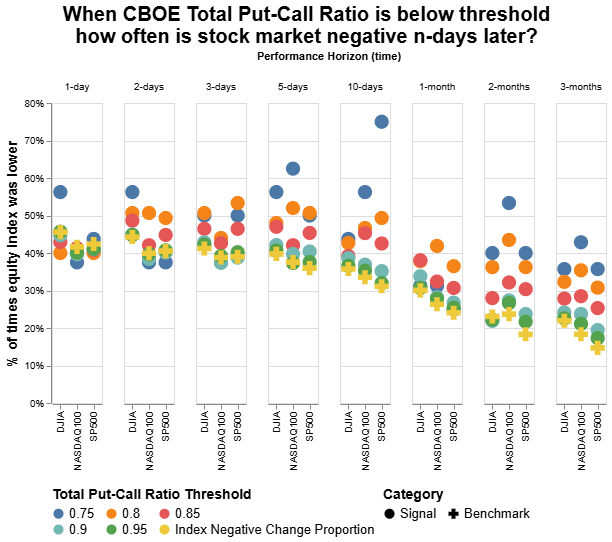
1Put-Call Ratio data from Chicago Board of Options Exchange 2Stock data from Yahoo! Finance On Friday the 9th of January the CBOE Total Put-Call Ratio (TPCR) hit 0.75. This is in the 4th percentile for 2024-2026 and values equal or below 0.75 have occurred 25 times in the last ~500 trading days. The average 5-day change in the Nasdaq 100 starting from a day the TPCR hit 0.75 or below, was -0.81%. The average 5-day change across the entire 2-year history was +0.4%. From Friday 9th Jan to 16th Jan close of trading day (5-trading days later), the Nasdaq 100 was down -0.34%. So technically, this would count as another confirmation of the signal’s predictive potential, which we covered on 11 January 2026. We modified the chart from that day by:
One should exercise caution interpreting these results, however. We would have had more confidence in the predictiveness of this signal if there was more consistency or monotonicity across the time-horizons. Overall the interpretation is as follows: for a given threshold and time-horizon (e.g. 0.75 and 10-days), if the coloured circle lies above the yellow cross, it means that the relevant index was negative more often over that time horizon after hitting a TPCR threshold or below, than over that horizon in general (i.e. any random 10-day period). The CBOE TPCR hit 0.73 this past Friday 16th January, lower even than the lowest threshold we tested. This value or below only occurred 13 times in the last 500 trading days. If you expect this signal to hold again then the Nasdaq100 could be lower again by the end of this week. Weekend markets are currently showing some negative expectations following US President Trump’s tweets about putting tariffs on European countries that disagree with the US approach to Greenland’s “acquisition” but there is a lot of time between now and Tuesday's market open, nevermind Friday. The Price of Protein - 16 January 2026The US government recently upended the old food pyramid and is calling for Americans to emphasize protein in every meal. Whether this is in service of public health or the cattle lobby, we may never know. But we expect it probably won’t arrest surging beef prices. We previously postulated that Ozempic might have a deflationary impact on spending not just on waistlines, and a paper in the Journal of Marketing Research found that households reduce their grocery spending by 5-8% on average within 6 months of starting. We should have caveated our statement - it may reduce overall spending, and it may reduce spending on (and prices of) specific goods a lot. However it seems likely that the cost of some foods may go up significantly. And with the US government now pushing protein harder than ever, it seems likely that sources of protein could see continued price increases. We have a particular hunch about cottage cheese (because parmesan is already expensive). In the UK, demand for whey protein has gone up. And annual beef price inflation hit 27% despite demand volumes dropping since before the recent price spike, a dystopian reminder that maximum profit (even for food producers) might occur with selling lower volumes at higher prices. Question for the future
Consumer Surplus and a Shrinking Pie - 15 January 2026This is not really a snippet but rather a collection of thoughts that will be expanded on in more detail later At the root of much of the geopolitical, social, and financial market events of the last few years lies, we believe, a fundamental shift in political attitude - a shrinking (or less slowly growing) economic pie. And given that the expectation not that long ago was of a growing pie, even a less slowly growing pie may feel like a shrinking pie. A local proxy for this is simply inflation, particularly of things like house prices. For many years we were happy with globalisation - relatively free movement of people, goods and ideas. Specialisation and division of labour, offshoring, and regulatory arbitrage saw declining prices and rising living standards across much of the world. There is now significant opposition to this and increasingly so on an ideological level. What was the cause of this shift? Part of it can be explained by shifting demographics. Much of the world has both a fertility rate below replacement and an aging population able to produce less output so there is reason to believe that output per person (the pie) will decline unless productivity increases. Covid and the realisation of supply chain vulnerability likely also played a role. Poor policy is also to blame for the shrinking pie and while there are many contenders for worst policy choice, surely amongst the top ones is the approach that much of the Western world has taken to homebuilding. We hesitate to call it a nimbyist approach because of its connotations, but through incompetence or malice, and with a sprinkling of climate panic (not without reason, admittedly), the Western world has made it increasingly difficult to build homes where people want them. This effectively limits the supply of homes which maintains (and increases) house prices. Housing shortages have extraordinary downstream effects including lower fertility, as many people put off family formation and having children. In cities like London it plays role in suppressing economic growth, as skilled workers are unable to move to where the jobs are. Another underappreciated cause of this we would like to highlight relates to the notion of consumer surplus, specifically with regards to the role that consumer data collection plays in transferring consumer surplus to producers. With an increasingly detailed consumer profile of every consumer being constructed through data collected on them, it is getting easier to find out exactly how much someone is willing to pay for anything. In combination with algorithmic pricing, a practice whereby prices for products are set automatically with the help of data collected about both customers and the market environment, this makes it hard to imagine why the prices for many things may ever come down outside of a consumer-spending driven recession. Arguably one of the most significant recent developments of this might be the introduction of LLMs to the personal healthcare space (more on this in the near future). Looking to the future - there are certain industries and products where consumer surplus is still very large and therefore present potential targets for surplus-transfer by producers:
One of the manifestations of "shrinking pie" behaviour is seeking to increase the yield from an existing resource. Unfortunately for consumers this means getting people to pay more for the same thing, instead of producing more of the thing and selling it to more people for less. Should the US invade (or buy) Greenland? - 14 January 2026Let’s begin with a strong statement. The US should under no circumstances militarily invade Greenland while it is under the sovereign control of Denmark. Does this calculus change if China or Russia, for example, invaded or otherwise established a strong military presence there? Maybe. Under the current circumstances, we also think a US invasion is very unlikely as it would represent an extraordinary act of aggression against an important ally (i.e. NATO by way of Denmark), despite the recent rhetoric of the Donroe Doctrine. Greenland is not Venezuela. What’s more - why invade when you can buy? Should the US buy Greenland? That is a far more interesting and relevant question. Would it be good for the US? Probably - Greenland is rich in important resources and has a critical strategic location. Would it be good for Greenland? For Denmark? For the rest of the world? Perhaps one should ask this question with an eye toward the future. What was 2015’s 10-year view of the future? This was before President Trump’s first term, the first trade war, Brexit, China’s major growth scare, Covid, the Russian invasion of Ukraine. And so the likely answer would probably have been something involving more of the same - a continuation of the plus-sum, pro-trade, globalisation-centric, collaborative, international rules based order. In 2015. Now, however, this does not seem to be the case. The order is fraying, to put it mildly. And the prospect of a major conflict in the next 10 years between nuclear powers seems much more likely than it did in 2015. This should dramatically change the calculus for all parties involved in this issue. And so now we must ask - how much? In a very crude way, what might Greenland be worth? One could use the GDP as an estimate of annual “revenue”, assign some sort of discount factor or multiple and value it on that basis. However Greenland’s GDP is 40-60% government spending, nearly half of which is significantly reliant on a Danish grant, which comprises about 20% of GDP. We can already hear someone saying “this is not a profitable country”. Alternative estimations might use the supply of natural resources. It is rich in oil and natural gas with a US geological survey estimating nearly 18 billion barrels of oil and over 4 trillion cubic meters of natural gas. Even with an unrisked estimate of 4 billion barrels of oil, an initial 1 billion barrel target, at current prices alone, could be worth $60 billion. There are several estimates out there, taking into account real estate and rare earth minerals. Nevermind paying each Greenlander $100 000 - might as well make it $1 000 000 or $10 000 000. If the US offered each Greenlander $1 000 000 and US citizenship, along with a stronger military presence, would that really not pass a popular vote? We are skeptical. Did the Fed’s treasury-buying1 dampen stablecoin2 redemptions' impact on short-term US treasury yields? - 13 January 2026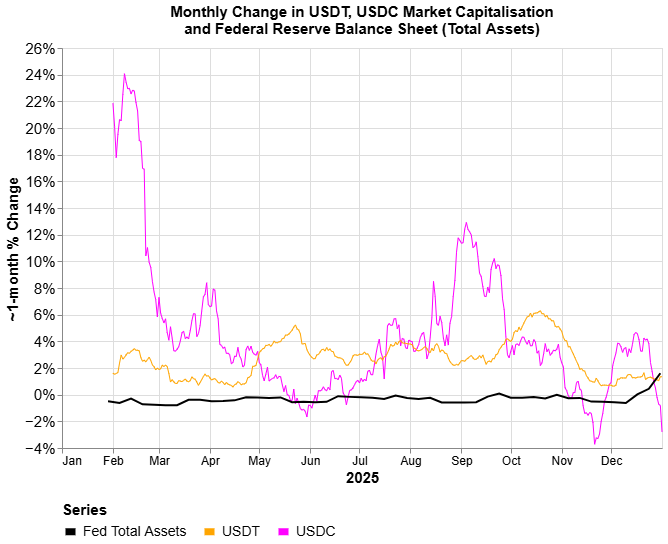
1Fed Balanace Sheet data from St Louis FRED 2Stablecoin market cap data from CoinMarktetCap The Federal Reserve started adding to its balance sheet again in mid-December by buying up $40 billion worth of short dated treasury securities. This was purportedly purely for liquidity management and follows signs of liquidity stress in October. We wonder whether the impact of the Fed’s securities purchases may have dampened the impact of stablecoin redemptions on short-term US treasury yields, after the dramatic selloff in cryptocurrencies in the last quarter of 2025. Tether, the issuer of USDT, and Circle, the issuer of USDC, together comprise the overwhelming majority of the stablecoin issuance market. And stablecoin issuers are, collectively, one of the largest holders of short-dated US treasuries, as large as some countries (e.g. Germany, South Korea). And while this may be a small share of overall US debt, a BIS paper finds that significant flows in and out of stablecoins have an impact on 3-month treasury yields, with outflows increasing yields 2-3x as much as inflows decrease them. Treasury bills and other cash-like securities are bought and held by stablecoin issuers as collateral to support the peg of their respective stablecoins against the US dollar at a ratio of 1:1. In theory the peg is safe as long as the issuer holds enough money-like collateral to support the peg. At time of writing the USDT market capitalisation was around $186 billion and the USDC market cap around $75 billion. In the past when the price of cryptocurrencies has been rising, the demand for stablecoins has been high or increasing. This has led to an increase of issuance and as a result an increase in the purchase of collateral by these issuers. In theory, the converse could be true - if cryptocurrency prices decline, demand for crypto and stablecoins may decrease and people may wish to redeem their stablecoins. This would lead to a reduction in the market capitalisation of the relevant stablecoin, and a sale of that issuer’s collateral. In this case, quite possibly, short-term US treasuries which are liquid and easy to sell, which could lead to their yields increasing. After the recent market peak in October 2025, major cryptocurrencies declined significantly. Bitcoin went down from a peak of $123 000 to around $82 000, a drop of nearly 33%. All told, the broader cryptocurrency market cap declined ~33% from around $ 4.3 trillion to $2.9 trillion. It is not a surprise that USDC saw its market capitalisation decline during that selloff. Tether, interestingly, remained resilient. Hunting Academic Fraud - Prediction Markets Part 2 - 12 January 2026A British scientist has been granted a $2.5 million+ reward from a settlement for a claim filed against the Dana-Farber Cancer Institute under the US False Claims Act. This brings to mind an initiative by Bill Ackman in 2024 when his wife was embroiled in a plagiarism case involving Business Insider and the faculty of MIT. He could likely dedicate significant resources exclusively to the task of finding plagiarism in academic journals but not everyone has these sorts of resources. In the US the False Claims Act provides for whistleblowers to receive a bounty of up to 30% of a settlement amount, if they disclose information showing that a fraud led to financial loss for the government. But a lawsuit can also be a costly and time-consuming endeavour. Perhaps this presents an opportunity for prediction markets. PolyMarket offers prediction markets on lawsuits, including the outcome of the Supreme Court decision on President Trump’s tariffs, as well as whether President Trump will sue Federal Reserve Chair Jerome Powell. There is clearly already a precedent. We imagine that a prediction market could be set up around questions such as:
Our tests for a good prediction market:
We posit generally that this practice can be a good thing. There is enormous potential for abuse, of course. And so this should be closely monitored by relevant authorities. Prediction markets aside, this lawsuit result and its associated press coverage may very well spur on other sleuths to go looking for flaws in academic articles.This also ties in to a broader theme of prominent figures taking a strong stance against fraud in public spending (e.g. Elon Musk’s notorious DOGE efforts in 2024, and more recently comments by Chamath Halipitiya regarding waste and potential fraud in California). Question for the future
Updates The Wall Street Journal yesterday (11 January 2026) covered the use of prediction markets as a form of price insurance in real estate, which we covered on 6 Jan 2026. Testing Predictive Signals - 11 January 2026See Main Page for today's publication Stock Market1 Extremes? - 10 January 2026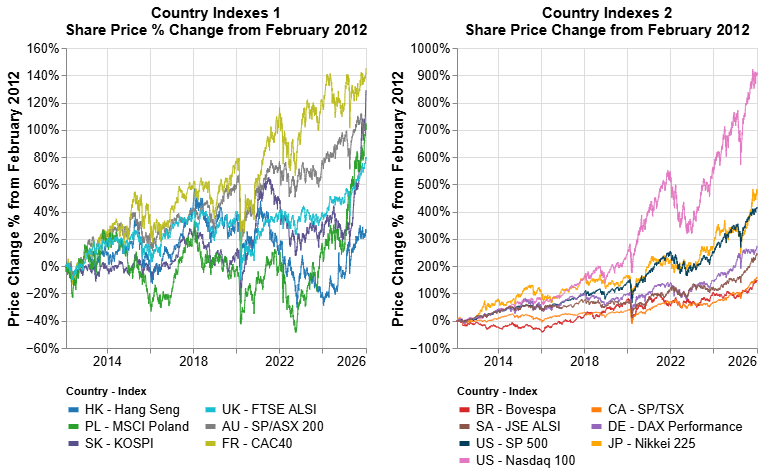
1Stock data from Yahoo! Finance Just because a stock is at an all-time high does not mean it is overvalued or due for a correction. We live in interesting times - markets are being driven by AI companies, and there is sufficient geopolitical strife and uncertainty that getting access to the resources that power it, which currently depend on an interconnected global web of supply chains, is no longer a foregone conclusion. And when one thinks of financial markets as being, at their core, about capital allocation then the US financial markets are allocating a huge amount of capital towards, effectively, securing the resources needed to continue the AI revolution in a more uncertain future. Nevertheless, it is quite impressive to see just how many indexes are at all time highs. Across a number of large equity markets, in developing and industrialised nations, equity market indexes are near record highs. But another observation can also be made - in the past, some markets set new all time highs for extended periods of time before experiencing any sort of substantial drawdown. That said, it might be worth beginning to investigate the reliability of certain market “top” signals. Some caveats
Do institutional investors significantly impact the market for US single family residential houses? - 09 January 2026US President Trump recently tweeted that he was going to take steps to ensure that large institutional investors (IIs) could not continue to buy single family residential homes (SFRs) in the US. Almost immediately after, the share price of two major IIs (Invitation Homes and American Homes 4 Rent) as well as a large private equity firm (Blackstone) dropped sharply. Some pundits were quick to point out that policy failures like zoning issues are what has led to housing shortages and high prices, not institutional ownership. They point out that IIs are a very small proportion of owners of the overall US SFR housing stock (ranging anywhere from 3-5%) and so can’t likely influence prices. This misses a few important caveats as investors make up a large proportion of:
It is worth noting that mortgage rates in the US hit their highest levels in 20 years in October 2023, with 30-year mortgage rates hitting nearly 8% and only coming down to 6% this year. And with nearly 54% or 30 million households with mortgage rates below 4%, many do not have an incentive to sell or attempt to trade up. Question for the future
Can hyperscalers help drive traditional media...higher? - 08 January 2026Much was said in 2025 about the “circular deals” phenomenon amongst the companies involved in building the hardware/infrastructure for LLMs (including the chips and, increasingly, energy provision). This has, possibly, helped to inflate/elevate the share prices of some of these companies. We wonder whether this may soon happen, and perhaps has already been happening, with traditional media companies. Copyright holders of various sorts are suing, and have sued, LLM companies with mixed success. NYT is suing Perplexity (and Microsoft and OpenAI). Anthropic agreed to pay $1.5billion in a settlement with book authors. And there are some licensing deals already out there. In May 2025 the New York Times signed a licensing deal with Amazon for its content. The deal is in the range of $20-$25 million. Its share price, incidentally (could be entirely unrelated), is up nearly 30% since then. So let’s take a closer look at some of the NYT’s numbers. The New York Times group had a trailing 12-month revenue of $2.8 billion and net income of around $338million. So this single licensing deal is ~1% of revenue or 8% of net income. If you classify the licensing deal directly as earnings, the extra 8% in earnings is worth an additional 8% in market capitalisation. Admittedly, this is very hand-wavy and back-of-the-envelope math, at best. But this is also only one licensing deal, from one hyperscaler. There are potentially more of these licensing deals to be made, with other hyperscalers. And as AI slop becomes more ubiquitous, ironically, the value of verified, high quality “traditional” editorial media content may increase due to relative scarcity. There is another factor that makes this market interesting - a large number of publishers and traditional media companies are privately held which means there might be more scope for somewhat creative accounting. Question for the Future
The End-of-the-World Trade - Part 1 - 07 January 2026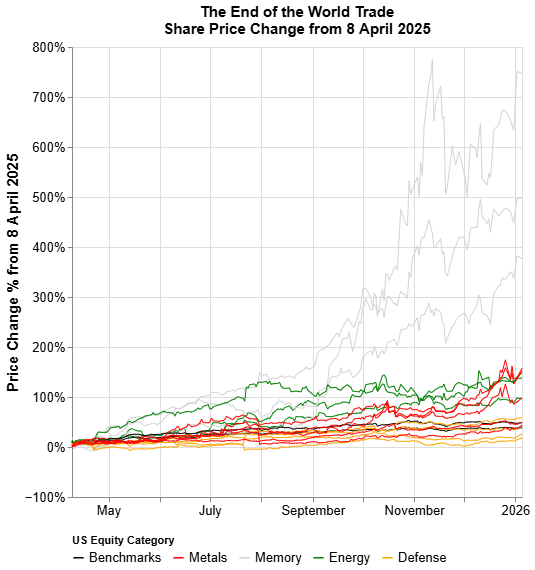
1Stock data from Yahoo! Finance With the US “invasion” of Venezuela, the US and UK seizure of a Russian-flagged ship in the North Atlantic, and protests in Iran spreading to more provinces, there is a whiff of “end of the world” in the air. Not necessarily apocalyptic, but probably an end of the old world order of relatively peaceful, plus-sum globalisation and trade. Following hot on the heels of a year of tariff tit-for-tat, this is not new. But the fever seems to be building. (Interesting note - Venezuela supplies about 4% of China’s oil imports, and Iran around 14%). This “end of the world” may happen to varying degrees of calamity. But at the core of this admittedly still somewhat amorphous idea lies a disintegration of the rules-based, collaborative international order. And stemming from this, a dramatic increase in the need for self reliance, at the very least on a national level, and an associated increase in decentralisation. So what does preparing for decreased collaboration, or even for outright conflict, look like for a superpower like the US? Well, probably a stockpiling of materials and reshoring of capacities that enable modern society and financial markets to operate:
If one looks at the relative performance of the above over the last year, and particularly since the bottom of the market in April 2025, even in comparison to high-performing equity indexes like the NASDAQ 100, there has been enormous demand for these. A series of social media posts today have singled out defense companies in particular, with President Trump calling them out for dividends, stock buybacks and executive compensation, even going so far as to single out Raytheon as a specific manufacturer. Whether or not the “world is ending”, one thing is for sure - like selling downside protection to retail “perma-bears” in an AI-fuelled market rally that doesn't seem to want to end, preparing for the end of the world is very big business indeed. The biggest. Some thoughts on Prediction Markets - Part 1 - 06 January 2026Prediction markets could, in theory, facilitate something that financial derivatives have never been able to - highly specific risk hedging (insurance) for the general public. Futures contracts, the original derivative, were invented to enable farmers to insure themselves against nature - a very useful feature of financial innovation. But these contracts and other derivatives tend to be highly standardized, require a fair amount of financial literacy and sophistication, and tend to be traded on margin (with debt) which for most of history made them risky and somewhat inaccessible. And until recently, most bookmakers were limited to sports or maybe some political races, in terms of markets they would make. But now with platforms like Polymarket and Kalshi, you can place bets on virtually anything, ranging from whether Trump might acquire Greenland before 2027 to which movie will win the Best Picture Oscar. Extraordinary entertainment value aside, the granularity of these markets means that it is easy to imagine a world in which one could e.g. protect oneself from rising house prices, by simply placing “Yes” bets on “Will house prices increase in Area XYZ?”. At the moment, the only way to hedge yourself against rising house prices is to buy real estate, shares in public or private real estate companies, or other inflation-resistant or real assets (e.g. silver or gold).These have significant disadvantages, including being non-specific (what if you care specifically about houses in a certain area?) which could potentially be resolved with prediction markets. We are not so naive as to imagine that only good outcomes will arise. Prediction markets attract, among others, gamblers and “retail traders” who are notoriously good at losing money. And with market maker firms like Jane Street (allegedly) and Jump Trading (officially) joining in, the retail trader is now sharing the pool with the best paid sharks (said with affection) in the business. Be careful out there. Question for the future
Examples of some interesting potential prediction markets:
Moore, Swanson, and Batteries (and maybe a bit of Jevon’s Paradox) - 05 January 2026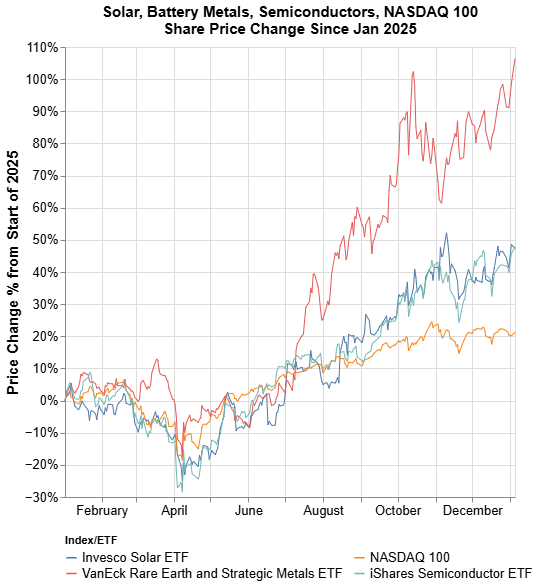
1Stock data from Yahoo! Finance Note: We have previously held a substantial holding in the VanEck Rare Earth and Strategic Metals ETF (REMX) and continue to hold a position in it. Prices can seem to drop year after year, until they don’t. Moore’s law is dead, so declared Jensen Huang in 2022 and predicted Bob Calwell back in 2013. The doubling of transistors on an integrated circuit every two years does not seem to be happening anymore. Swanson’s law refers to a similar finding - an industry specific application of Wright’s law whereby the price of solar photovoltaic modules seem to halve for every doubling of cumulative shipped volume. There appears to be a similar phenomenon for electric batteries - a significant reduction in cost over time, as installed capacity (and EV vehicle production) has increased dramatically. Whether causal or not, a commensurate increase in industry and supply concentration has been associated with these cost reduction phenomena, both geographically and by manufacturer capacity. The solar PV, semiconductors, and some battery minerals supply chain exhibit this phenomenon. In more concentrated markets, it is easier for suppliers to raise prices and control the supply and such a market is more vulnerable to external shocks. For microchips, one example of such a “shock” was the advent of LLM-driven AI and the sharp increase in demand. The resultant meteoric rise in price of the hardware underlying this technology, and the share price of manufacturers, speaks for itself - supply was not able (or willing) to meet the increased demand with production quantities that would have held the market price steady. While it may be too early to tell, we suspect that we find ourselves in a similar position now with batteries and the solar PV supply chain:
Fire in Berlin (and a Battery in Every Home) - 04 January 2026A fire in Berlin has left nearly 50 000 homes and 2200 businesses without power. Officials suspect arson and have compared the events to previous suspected arson attacks. This time however it’s -6C in Berlin and the local heating system has been affected as well. It may take several days before electricity and heating are restored to many of these houses, and emergency housing has been set up for people affected. In March 2025 when the Hayes substation fire that shut down Heathrow happened, airline stocks fell in the next trading session. It made us wonder whether “market manipulation by sabotage” would increase during 2025. Both the Heathrow and Berlin fires have underscored the importance of having substantial backup power facilities - both at household and industrial scale. With utility-scale backup battery installations becoming cheaper, and grid failures and interruptions seemingly becoming more frequent, we expect the pressure for action on this front to increase. And given that a combination of solar and battery storage are the most readily deployable backups, demand for these might increase. Also, if there is an expectation of increased geopolitical conflict (e.g. with China or Latin America, key producers of rare earth and battery minerals) that could raise future prices of the critical minerals needed to build these systems, it may well create demand in the present for these minerals. Question for the future
Can Real Interest Rates1 Predict the Stock Market2? Maybe - 03 January 2026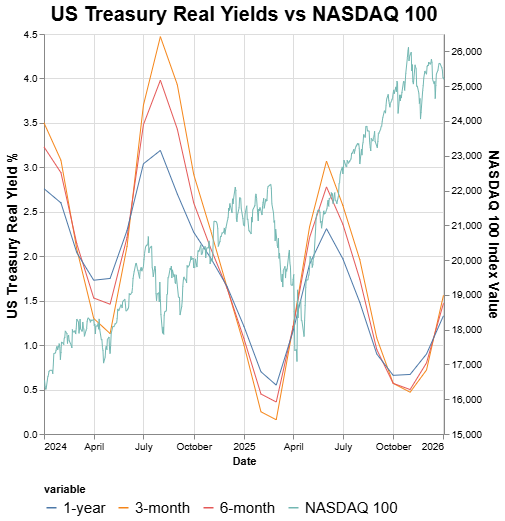
1Real yield data from Econforecasting.com 2NASDAQ 100 Index data fromYahoo! Finance Real interest rates matter and could impact financial markets. They are inflation-adjusted interest rates. One reason is that real yields on government bonds e.g. US Treasuries are seen as the benchmark risk-free rate. If you can get a guaranteed 5% inflation-adjusted return on your investment in bonds, then equities could seem less attractive and so investors may allocate more capital towards fixed-income and less to equities. Real interest rates are also used as a “discount factor” - they are used to calculate the present value of future cash flows of an investment. A higher discount rate (larger denominator) implies a lower present value. Real interest rates can go up, mechanically, for two reasons - either nominal interest rates are going up or inflation is coming down. In this manner, perhaps counterintuitively, a higher rate of inflation means a lower real interest rate. While the real rate is not the only important variable, it is interesting to compare it with the NASDAQ 100 over the last 5 years in which there are 3 examples where tightening real rates preceded or coincided with a significant stock market correction:
It is interesting to note that in the most recent market high was reached in October 2025 and that real interest rates have been climbing steadily since then. There was a small (but still significant) ~8% correction in the NASDAQ100 around then. Note: There are other interpretations for what real rates and their changes signify e.g. real rates going down might signal expected economic weakness (a good contender for why there was a 2025 correction in Q1, in addition to the market turmoil caused by tariffs) and vice versa, which would actually make the relationship positive between real rates and equities. And given that inflation data is only released with a lag, and may be somewhat backward looking, getting the direction of causality, if any, right is a challenging task. But remember - if someone could predict inflation or interest rates accurately, you would not know about it. They’d be sitting in a hedge fund on a pile of gold that stretched to the sky. Question for the future
Use UK Wind Curtailment Payments1 and Energy to Mine Crypto in Scotland - 02 January 2026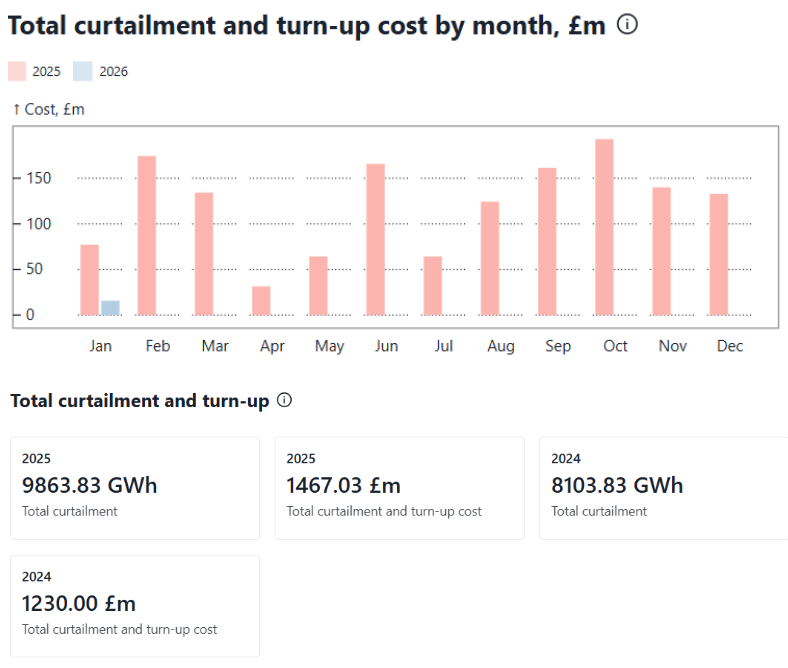
1Curtailment cost data from Robin Hawkes In 2025 the UK spent nearly £1.5 billion in curtailment and turn up costs for wind power generation - that is, money paid ultimately by the consumer for wind farms to stop producing power (curtailment) and for gas or other electricity providers to step in (turn up), due to electricity grid constraints. Grid constraints are increasingly the limiting factor in power distribution (in the UK and elsewhere) however given the significant annual curtailment costs, there are some proposals to reduce waste:
Surely there is a combination of the above which can convert the wasted curtailment expenditure into a more useful resource. Deploying a bitcoin mining rig, for which the primary expenditure after deployment is energy/electricity, in conjunction with a battery energy storage system, seems most promising. This idea has clearly been around for some time, with Bitcoin talk forum members alluding to it as early as May 2018, and with much more specific interest since January 2025. It was also proposed on the Scotland Government website in 2022. Major DRAM Manufacturers1 - 01 January 2026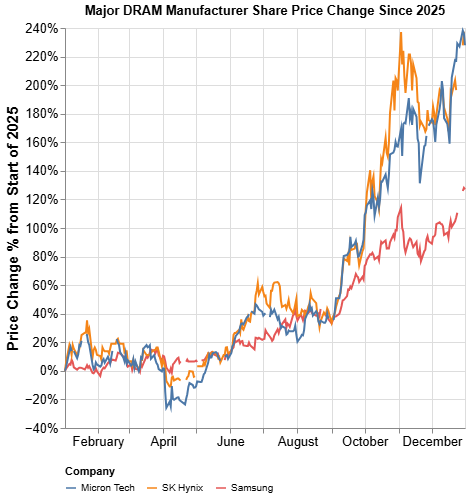
1Stock data from Yahoo! Finance Consumer surplus is a good proxy for happiness. It is the monetary benefit consumers gain when they buy something for less than they are willing to pay. It is the feeling of exceeded expectations. Producers (companies) want to identify consumer surplus and transfer it to themselves - every dollar of consumer surplus is a dollar that the producer could be charging more (to that specific consumer - there are caveats/assumptions). How do producers do this? Simply put, by raising prices. But raising prices is not always easy. If you raise prices, consumers may find alternatives. If there are no alternatives, this could be because the producer is monopolistic/anticompetitive. Ideally, a producer wants to have market control or pricing power. However this could attract regulatory attention which is dangerous for the producer. So in addition to pricing power, a producer wants a narrative. A narrative is a believable explanation, or story, for why prices “are going up” rather than simply “we are increasing prices because we can”. And the enormous demands that the AI ecosystem is placing on resources is a very good narrative for increasing prices. Crypto Treasury Companies1 - Part 1 - 13 July 2025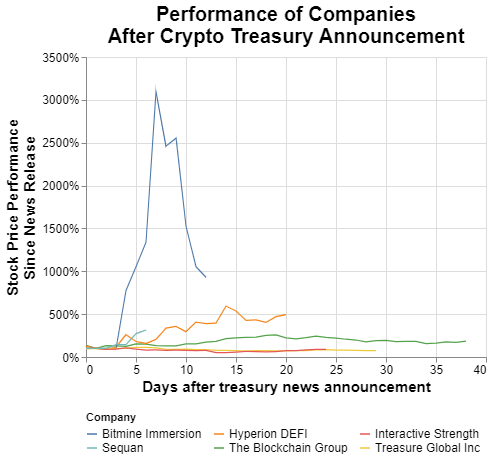
1Stock data from Yahoo! Finance Some Companies Have Seen Huge Stock Price Moves After Announcing Cryptocurrency Treasury Intentions Additional Warning:Investing in cryptocurrencies and cryptocurrency companies, listed or otherwise, may carry even greater risk than other investments. As this chart shows, crypto companies may experience extreme volatility, both positive and negative price action. This post is in no way a recommendation to trade in cryptocurrencies or related assets. The Smarter Web Company has been in the news for rocketing to a £1 billion valuation after its IPO with the aim to become a bitcoin treasury company, looking to capitalise on the valuation premium that Strategy (formerly Microstrategy) is currently enjoying over its bitcoin holdings. Given how well that has worked, other companies are likely to follow suit. And they have been. BitcoinTreasuries (not affiliated) maintains a database of companies that have become bitcoin treasury companies. Monitoring news websites (e.g. Twitter or MktNews) for companies that announce plans to become cyrptocurrency treasury companies could be a lucrative (if very risky) trading strategy. Question for the future
The Ozempic Economy - 25 May 2025Will Ozempic (and other GLP1s) have a deflationary impact on the global economy? In Apr 2024 12% (~30m) of American adults had tried a GLP1 and 6% (15m) were using one. Studies show calorie reduction of 700-900 per person, reduction of 16-39%, for users of GLP1s. Consumption reduction mostly hit processed foods, refined grains, and sodas or sweetened drinks. Starting with the conservative estimate of 15m current users and a 700 calorie reduction, that is roughly equivalent to removing 5 million people (assuming a typical 2000 calorie diet) from the market for certain foods. Could this already be having an impact on demand? The prices for certain foods have come down significantly. The prices of eggs, potatoes, orange juice, wheat, and sugar are down significantly over the last few months. Admittedly some of these foods are still up hugely since their pre-Covid level, and other factors (weather, avian flu) have undoubtedly had large impacts. And if you look at the shares of some of the largest processed food companies in the US, some of them are down significantly from their highs (Kraft Heinz down 25% since Oct 24, Tyson Foods down 42% since Apr 22, General Mills down 40% since May 23). Of course, again, other factors could have been at play. Question for the future
Risk Spectrum - The Flip - 14 April 2025In the not-so-distant future, government debt may come to yield more than other assets e.g. real estate or mega-cap corporate debt, or possibly the debt of less indebted nations.Some governments have a significant amount of debt and are speculated to struggle to repay that debt in the future, given assumptions about growth and global interest rates. Given the lack of recourse for investors of government bonds in the event of sovereign default, a flight to safety could lead to increased demand and therefore lower yields of other types of debt. This could also lead to certain credit spreads going to zero or even negative, which could have unexpected effects on certain pricing models. This could also lead to a tiered yield system in which the yield depends on the holder of the bond - where the government opts to selectively default on bonds held by certain investors but credibly guarantees (somehow?) repayment to others. The important question - can normal financial market operation continue when the “risk free asset” (US Treasuries) is no longer risk free, and/or when it has been replaced with something else? Disclaimer: Not financial advice. Please review original sources, conduct your own analysis and due diligence, and make your own investment decisions. Author takes no responsibility for the accuracy or inaccuracy of this data. If you want to get in touch you can reach us at hello at hedge-fund dot io |
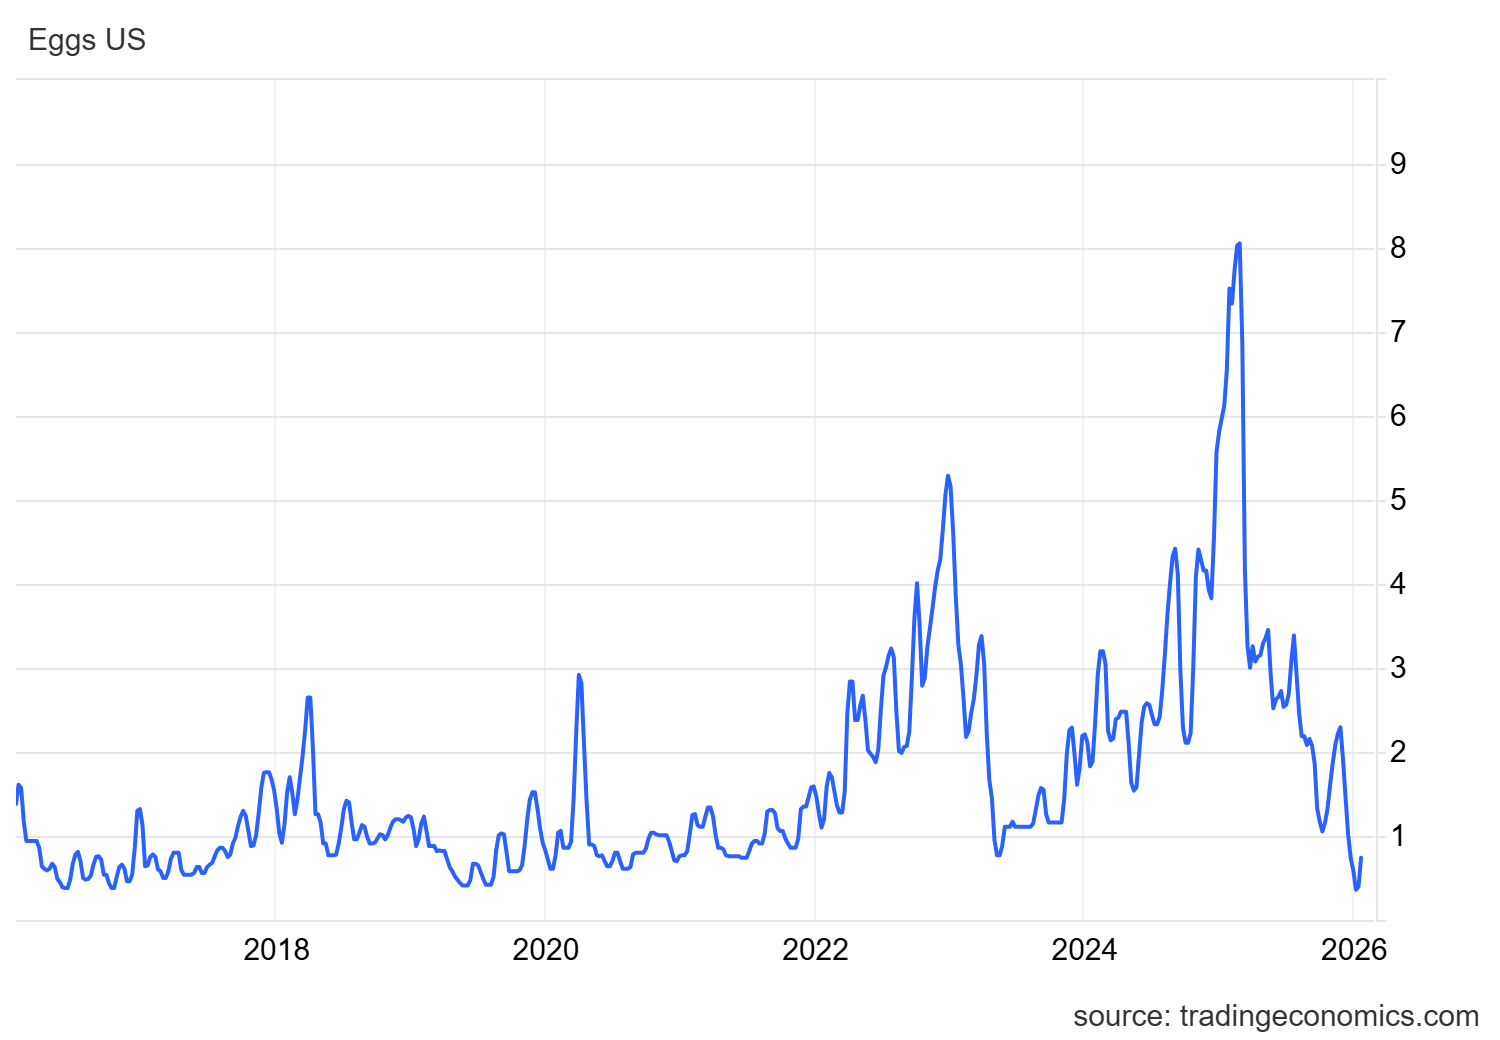
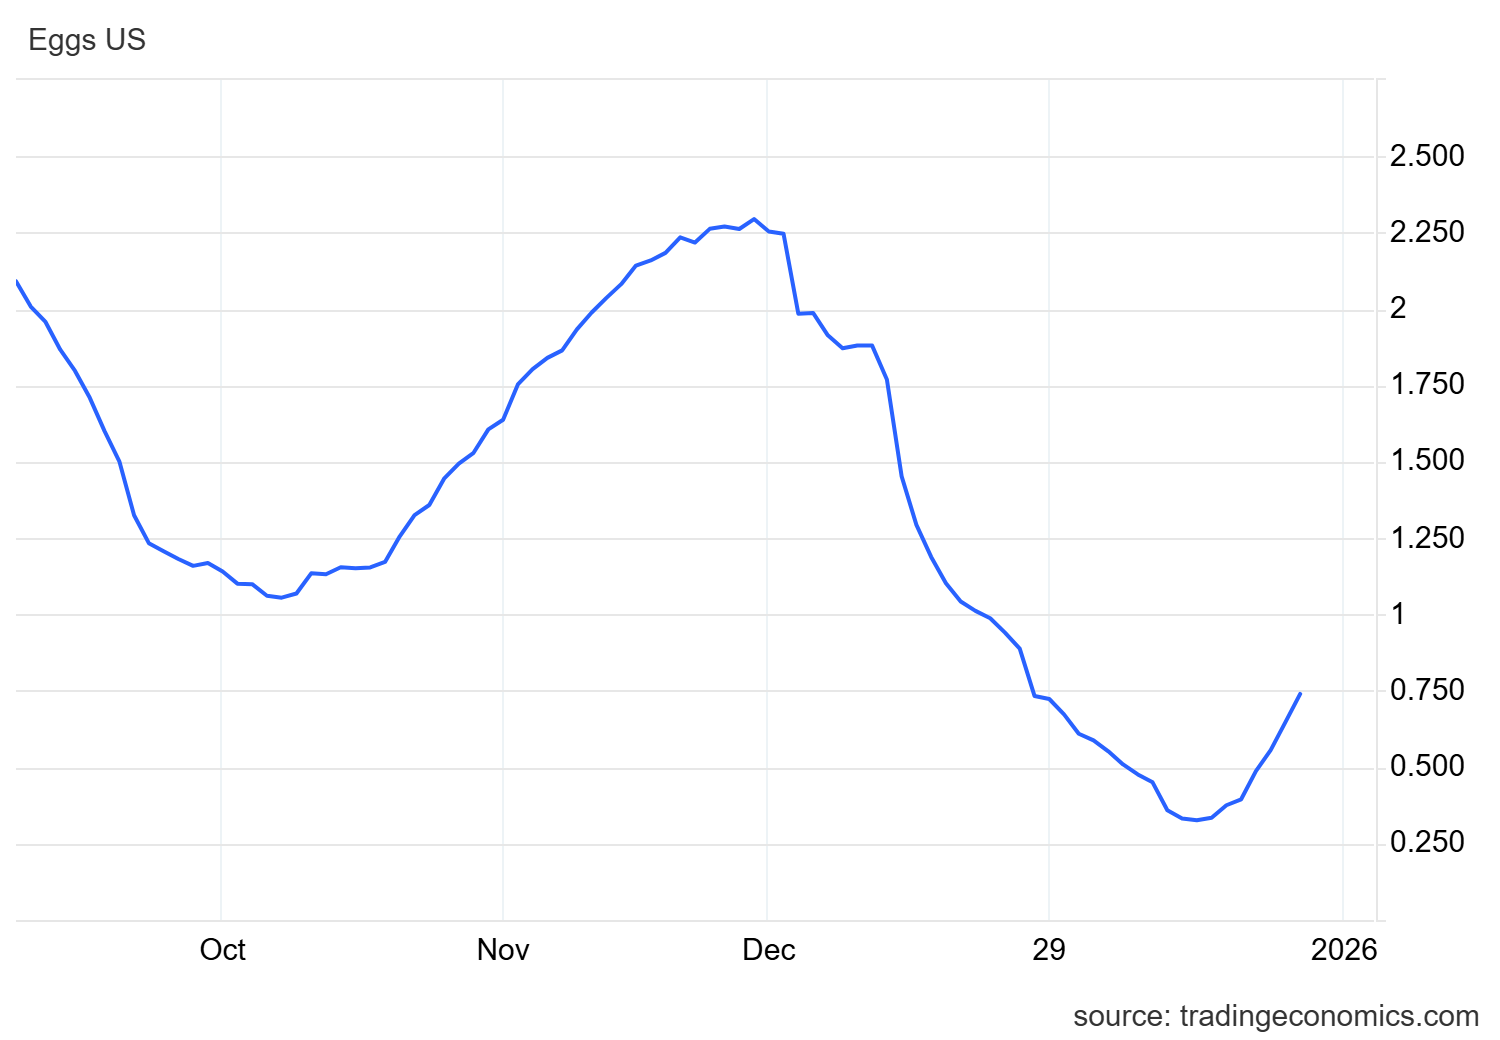